Figures & data
Figure 1. Flow diagram of patients enrolled in the cohort.
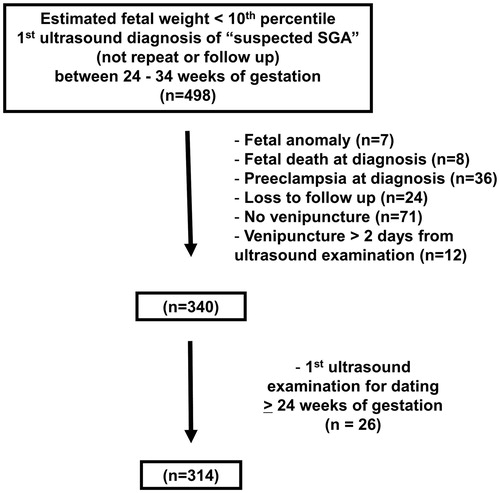
Table 1. Demographic and clinical characteristics of the study population.
Table 2. Indications for preterm delivery ≤ 34 weeks of gestation (n = 23).
Figure 2. Median plasma concentration of angiogenic/anti-angiogenic factors and pulsatility index (PI) of the umbilical (Umb) and uterine (UT) artery Doppler velocimetry in women who did or did not subsequently develop PE. (A) Patients with “suspected SGA” who subsequently developed PE had higher median plasma multiple of the expected median (MoM) concentrations of sVEGFR-1 and sEng than those who did not. [sVEGFR-1 MoM: median 2.4, interquartile range (IQR) 1.2–4.0 versus median 1.1, IQR 0.7–1.7; p < 0.001; and sEng MoM: median 0.96, IQR 0.84–1.2 versus median 1.7, IQR 1.3–4.2; p < 0.001]. (B) Median plasma MoM concentration of placental growth factor (PlGF), the ratio of PlGF/sVEGFR-1 and the ratio of PlGF/sEng in women who did or did not subsequently develop PE. Patients with “suspected SGA” who subsequently developed PE had lower median plasma MoM concentrations of PlGF, PlGF/sVEGFR-1 and PlGF/sEng than those who did not. [PlGF MoM: median 0.34, IQR 0.16–0.71 versus median 1.3, IQR 0.71–2.1; p < 0.001; PlGF/sVEGFR-1 MoM: median 0.12, IQR 0.06–0.72 versus median 1.1, IQR 0.59–2.0; p < 0.001 and PlGF/sEng MoM: median 0.20, IQR 0.05–0.64 versus median 1.3, IQR 0.74–2.2; p < 0.001]. (C) Median umbilical and uterine artery PI z-scores in women who did and did not subsequently develop PE. Patients with “suspected SGA” who subsequently developed PE had higher median umbilical and uterine artery PI z-scores than those who did not. [Umbilical artery PI z-score: median 0.83, IQR 0.17–1.7 versus median 0.35, IQR −0.35 to 1.0; p < 0.001; Uterine artery mean PI z-score: median 2.8, IQR 0.55–3.4 versus median 0.065, IQR −0.44 to 0.68; p < 0.001.]
![Figure 2. Median plasma concentration of angiogenic/anti-angiogenic factors and pulsatility index (PI) of the umbilical (Umb) and uterine (UT) artery Doppler velocimetry in women who did or did not subsequently develop PE. (A) Patients with “suspected SGA” who subsequently developed PE had higher median plasma multiple of the expected median (MoM) concentrations of sVEGFR-1 and sEng than those who did not. [sVEGFR-1 MoM: median 2.4, interquartile range (IQR) 1.2–4.0 versus median 1.1, IQR 0.7–1.7; p < 0.001; and sEng MoM: median 0.96, IQR 0.84–1.2 versus median 1.7, IQR 1.3–4.2; p < 0.001]. (B) Median plasma MoM concentration of placental growth factor (PlGF), the ratio of PlGF/sVEGFR-1 and the ratio of PlGF/sEng in women who did or did not subsequently develop PE. Patients with “suspected SGA” who subsequently developed PE had lower median plasma MoM concentrations of PlGF, PlGF/sVEGFR-1 and PlGF/sEng than those who did not. [PlGF MoM: median 0.34, IQR 0.16–0.71 versus median 1.3, IQR 0.71–2.1; p < 0.001; PlGF/sVEGFR-1 MoM: median 0.12, IQR 0.06–0.72 versus median 1.1, IQR 0.59–2.0; p < 0.001 and PlGF/sEng MoM: median 0.20, IQR 0.05–0.64 versus median 1.3, IQR 0.74–2.2; p < 0.001]. (C) Median umbilical and uterine artery PI z-scores in women who did and did not subsequently develop PE. Patients with “suspected SGA” who subsequently developed PE had higher median umbilical and uterine artery PI z-scores than those who did not. [Umbilical artery PI z-score: median 0.83, IQR 0.17–1.7 versus median 0.35, IQR −0.35 to 1.0; p < 0.001; Uterine artery mean PI z-score: median 2.8, IQR 0.55–3.4 versus median 0.065, IQR −0.44 to 0.68; p < 0.001.]](/cms/asset/959ed3e4-46b8-4b59-b5ff-0de19484aa11/ijmf_a_1048431_f0002_c.jpg)
Figure 3. Median plasma concentration of angiogenic/anti-angiogenic factors as well as pulsatility index (PI) of the umbilical (Umb) and uterine (UT) artery Doppler velocimetry in women who subsequently required indicated preterm delivery at or before 34 weeks of gestation and those who did not. (A) Patients suspected to have SGA fetuses who subsequently required indicated preterm delivery had higher median plasma multiple of the medians (MoM) concentrations of sVEGFR-1 and sEng than those who did not. [sVEGFR-1 MoM: median 3.0, interquartile range (IQR) 1.4–6.4 versus median 1.1, IQR 0.72–1.7; p < 0.001; and sEng MoM: median 2.4, IQR 1.1–6.6 versus median 0.98, IQR 0.85–1.2; p < 0.001]. (B) Median plasma MoM concentration of placental growth factor (PlGF), the ratio of PlGF/sVEGFR-1 and the ratio of PlGF/sEng in women who subsequently required indicated preterm delivery and those who did not. Patients with “suspected SGA” who subsequently developed PE had lower median plasma MoM concentrations of PlGF, PlGF/sVEGFR-1 and PlGF/sEng than those who did not. [PlGF MoM: median 0.18, IQR 0.072–1.3 versus median 1.2, IQR 0.70–2.1; p < 0.001; PlGF/sVEGFR-1 MoM: median 0.066, IQR 0.013–0.41 versus median 1.0, IQR 0.59–1.9; p < 0.001 and PlGF/sEng MoM: median 0.074, IQR 0.012–1.7 versus median 1.2, IQR 0.70–2.1; p < 0.001]. (C) Median umbilical and uterine artery PI z-scores in women who subsequently required indicated preterm delivery and those who did not. Patients with “suspected SGA” who required indicated preterm delivery had higher median umbilical and uterine artery PI z-scores than those who did not. [Umbilical artery PI z-Score: median 1.6, interquartile range (IQR) −0.21 to 2.8 versus median 0.36, IQR −0.32 to 0.89; p < 0.001; and Uterine artery mean PI z-Score: median 3.3, IQR 2.4–3.9 versus median 0.071, IQR −0.44 to 0.66; p < 0.001.]
![Figure 3. Median plasma concentration of angiogenic/anti-angiogenic factors as well as pulsatility index (PI) of the umbilical (Umb) and uterine (UT) artery Doppler velocimetry in women who subsequently required indicated preterm delivery at or before 34 weeks of gestation and those who did not. (A) Patients suspected to have SGA fetuses who subsequently required indicated preterm delivery had higher median plasma multiple of the medians (MoM) concentrations of sVEGFR-1 and sEng than those who did not. [sVEGFR-1 MoM: median 3.0, interquartile range (IQR) 1.4–6.4 versus median 1.1, IQR 0.72–1.7; p < 0.001; and sEng MoM: median 2.4, IQR 1.1–6.6 versus median 0.98, IQR 0.85–1.2; p < 0.001]. (B) Median plasma MoM concentration of placental growth factor (PlGF), the ratio of PlGF/sVEGFR-1 and the ratio of PlGF/sEng in women who subsequently required indicated preterm delivery and those who did not. Patients with “suspected SGA” who subsequently developed PE had lower median plasma MoM concentrations of PlGF, PlGF/sVEGFR-1 and PlGF/sEng than those who did not. [PlGF MoM: median 0.18, IQR 0.072–1.3 versus median 1.2, IQR 0.70–2.1; p < 0.001; PlGF/sVEGFR-1 MoM: median 0.066, IQR 0.013–0.41 versus median 1.0, IQR 0.59–1.9; p < 0.001 and PlGF/sEng MoM: median 0.074, IQR 0.012–1.7 versus median 1.2, IQR 0.70–2.1; p < 0.001]. (C) Median umbilical and uterine artery PI z-scores in women who subsequently required indicated preterm delivery and those who did not. Patients with “suspected SGA” who required indicated preterm delivery had higher median umbilical and uterine artery PI z-scores than those who did not. [Umbilical artery PI z-Score: median 1.6, interquartile range (IQR) −0.21 to 2.8 versus median 0.36, IQR −0.32 to 0.89; p < 0.001; and Uterine artery mean PI z-Score: median 3.3, IQR 2.4–3.9 versus median 0.071, IQR −0.44 to 0.66; p < 0.001.]](/cms/asset/69c72b27-99a8-4a0c-895b-bfcae20bd26a/ijmf_a_1048431_f0003_c.jpg)
Figure 4. Area under the receiver operating characteristic curve and sensitivity at 85% specificity for the identification of patients at risk of PE (A) and indicated preterm delivery at ≤34 weeks of gestation (B) using individual biochemical marker and Doppler parameter.
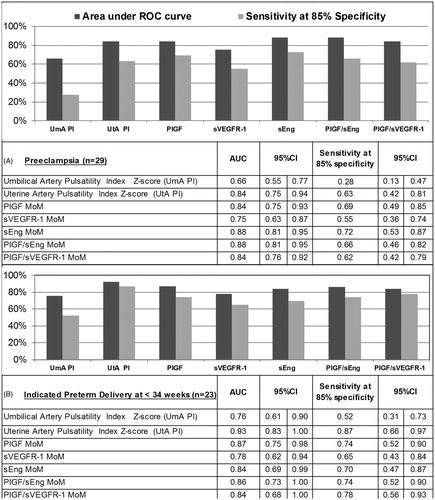
Table 3. Magnitudes of association between subsequent diagnosis of pre-eclampsia and maternal plasma concentrations of angiogenic and anti-angiogenic factors, unadjusted and adjusted for clinical factors and uterine and umbilical artery Doppler velocimetry.
Table 4. Magnitudes of association between subsequent indicated preterm delivery ≤34 weeks of gestation and maternal plasma concentrations of angiogenic and anti-angiogenic factors, unadjusted and adjusted for clinical factors and uterine and umbilical artery Doppler velocimetry.
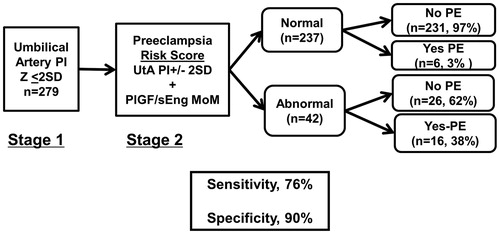
Figure 5. Risk of PE and/or indicated preterm delivery at or before 34 weeks of gestation conditional on a two-step screening approach. In the first step, Umb artery Doppler PI z-score was used to triage patients. In the second step, UT artery Doppler mean PI z-score abnormality and MoM plasma angiogenic/anti-angiogenic factor concentrations are used to identify patients that subsequently had the targeted outcome. Among patients who had normal Umb artery Doppler PI z-scores, 52% of those who subsequently developed PE had UT artery Doppler mean PI z-scores > 2SD; adding PlGF/sEng MoM to abnormal UT artery Doppler mean PI z-score increased the sensitivity to 76% at a fixed false positive rate of 10% (p = 0.06).