Figures & data
Figure 1. The fitting methodology and its control on program T- and C-levels (triangle and square markers, respectively). A. AutoNRT ECAP thresholds (circle markers) are measured (here at 22 electrodes intraoperatively). B. A program is instantly initialized, with an average dynamic range of 40CL, Master Volume set to 120 (inaudible or very soft), and Bass & Treble set to 0. C. Master Volume is gradually raised in the presence of live audio until comfortable. D. Bass & Treble are adjusted if desired. E. Three thresholds are measured if desired, bending the T-level profile. F. A Comfort check is performed if desired, adjusting selected bands of levels. Blocks A–D comprise the Remote Assistant Fitting methodology, and blocks A–F the Nucleus Fitting Software methodology. The deviation in levels at low frequencies is atypically large, chosen here to demonstrate the effect of profile scaling: the C-level profile is flatter than the T-level profile, and both profiles flatten when Master Volume is raised.
Figure 2. Remote Assistant Fitting on the Nucleus CR110 Remote Assistant. Left: AutoNRT in progress on the second of five electrodes. Middle: Master Volume adjustment. Right: Treble adjustment.
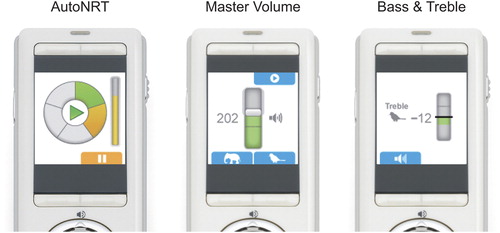
Figure 3. The Thresholds screen (left) and Comfort screen (right) of Nucleus Fitting Software. The two-screen design allows cochlear implant-specific detail to be avoided (for example, the Thresholds screen has an audiometer-like interface).
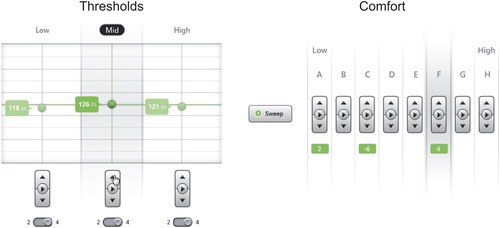
Figure 4. Group mean speech perception test results for Remote Assistant Fitting, Nucleus Fitting Software, and Custom Sound fitting methods, all three fitted by an experienced cochlear implant audiologist. No significant differences were found in any of the test conditions. For the sentence tests (right), a lower speech reception threshold indicates better speech perception in noise. Error bars represent the standard errors of the means.
Table 1. Group mean differences in speech perception test results between the Remote Assistant Fitting (RAF) and Custom Sound (CS) fitting methods, and between the Nucleus Fitting Software (NFS) and Custom Sound (CS) fitting methods, all fitted by an experienced cochlear implant audiologist. The means of the differences and the 95% confidence intervals (CI) of the means of the differences are given. For the sentence tests, a lower speech reception threshold indicates better speech perception in noise.
Figure 5. Group mean speech perception test results for the Remote Assistant Fitting method, as fitted by a recipient, and the Custom Sound method, as fitted by an experienced cochlear implant audiologist. Group A testing occurred in the same session as the fitting procedure. No significant differences were found in any of the test conditions. Error bars represent the standard errors of the means. Note that sentence tests were also scored by the percentage of words correct.
Table 2. Group mean differences (percentage of words correct) in speech perception test results between the Remote Assistant Fitting (RAF) method, as fitted by a recipient, and the Custom Sound (CS) fitting method, as fitted by an experienced cochlear implant audiologist. The means of the differences and the 95% confidence intervals (CI) of the means of the differences are given.