Figures & data
Table 1. Group demographics, questionnaire scores, and tinnitus characteristics. M = male, F = female, L = left, R = right, In head = central tinnitus.
Figure 1. Mean average hearing thresholds for tinnitus and no tinnitus groups. Post hoc t-tests of average hearing thresholds found no significant differences between or within participant groups (P > 0.05). Error bars represent one standard error of the mean.
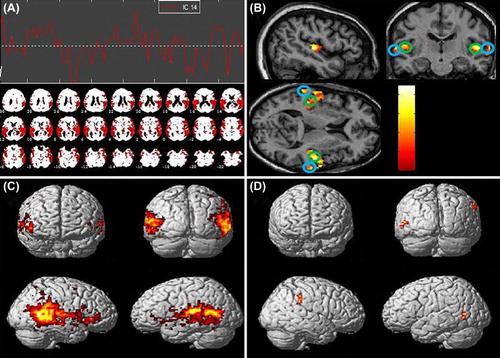
. (A) Auditory network component and time-course. (B) Whole group one-sample t-test of auditory component, masked with auditory template (P < 0.05, uncorrected). Primary auditory cortex regions (circled in green). Nonprimary auditory cortex regions (circled in blue). (C) Whole group one-sample t-test of auditory network component (P < 0.001, uncorrected). (D) Tinnitus > No tinnitus two-sample t-test (P < 0.01, uncorrected, 48 voxel extent threshold) showing increased connectivity in the right supramarginal gyrus and increased connectivity in the left posterior middle temporal gyrus.
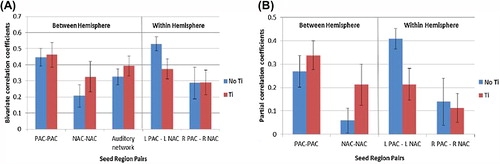
. (A) Average bivariate correlation coefficients (beta values) for each paired ROI. The ‘auditory network’ refers to a combined mean average derived from the BOLD time-series of primary auditory and auditory association cortical seed regions. (B) Average partial correlation coefficients for each paired ROI. Error bars represent one standard error of the mean. PAC = primary auditory cortex, NAC = nonprimary auditory cortex, L = left, R = right, Ti = tinnitus group, No Ti = no tinnitus control group.