1,664
Views
34
CrossRef citations to date
0
Altmetric
Original Article

Relationship between tinnitus pitch and edge of hearing loss in individuals with a narrow tinnitus bandwidth

, &
Pages 249-256 | Received 28 May 2014, Accepted 18 Oct 2014, Published online: 03 Dec 2014

Figures & data

Figure 1. Association between hearing level and the dominant tinnitus pitch. Top and middle panels illustrate audiometric thresholds for all 129 patients in the steeper (top panel) and less-steep (middle panel) ear with median shown by the solid black line. Bottom panel shows the distribution of the dominant tinnitus pitch derived from the similarity ratings.

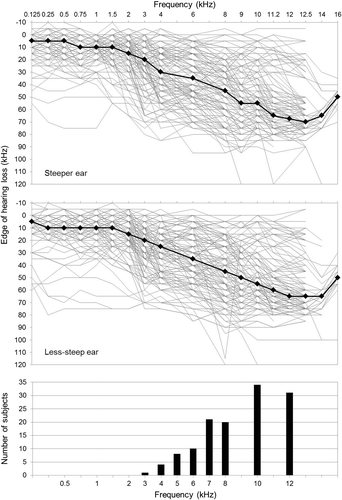
Table 1. Summary of audiometric information for included studies.

Figure 2. Scatterplots examining the relationship between dominant tinnitus pitch and the edge of the hearing loss in the steeper (top graph) and less-steep ear (bottom graph) in all participants with narrow tinnitus bandwidth.
Figure 3. Comparison of Pearson's correlation coefficients (dots) and confidence intervals (lines) in the current study and in CitationSereda et al (2011). Lines shown in black represent the subgroup of participants reporting a narrow tinnitus bandwidth. Lines shown in grey represent the whole recruited sample.

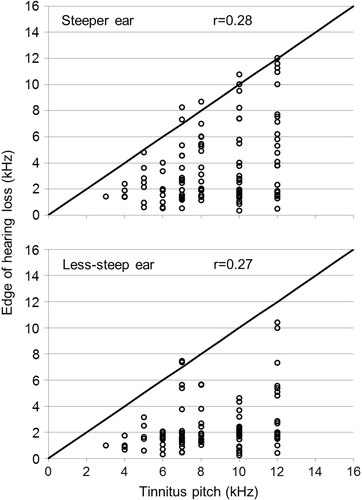
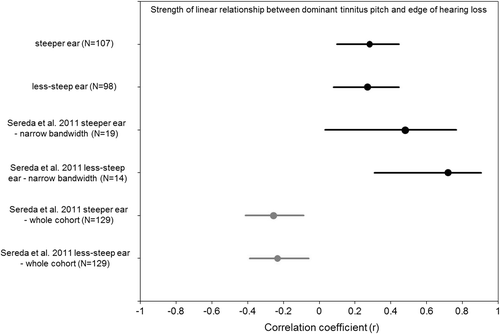
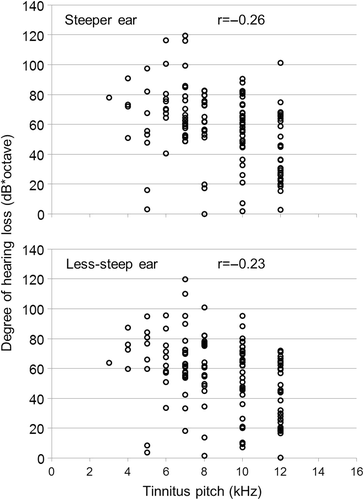
Table 2. Correlations between dominant tinnitus pitch and audiometric variables. HL = hearing loss.

Table 3. Details of the loadings of each of the eight principal components derived from the principal component analysis onto the original audiometric variables. Components are statistical constructs, but the individual loadings indicate the ‘meaning’ of each one. For example, principal component 1 most strongly represents the edge and the slope of hearing loss.

Figure 4. Scatterplots examining the relationship between dominant tinnitus pitch and degree of the hearing loss in the steeper (top graph) and less-steep ear (bottom graph).