760
Views
27
CrossRef citations to date
0
Altmetric
ORIGINAL RESEARCH

Pathophysiology of Evolution of Small Airways Disease to Overt COPD

, , , , , & show all
Pages 269-275 | Published online: 30 Jul 2010

Figures & data

Table 1. Anthropometric characteristics and respiratory function data of: 10 normal never-smokers, 10 smokers with normal spirometry (group O), and 40 COPD patients stratified according to GOLD12 (GOLD I to GOLD IV).

Figure 1. Relationship of fractional expired concentration of nitrogen to expired volume during SBN2 test in a non smoker (A), in a GOLD II COPD patient (B) and in a GOLD IV COPD patient (C) who did not exhibit a phase IV (please see text). Perpendicular arrow indicates closing volume (CC). The volume expired from total lung capacity (0 volume) to this arrow is “open capacity” (“OC”). The four phases (I-IV) are indicated. Broken lines: slope of phase III. Note: (1) presence of cardiac oscillations in A but not B and C, and (2) marked increase of slope of phase III in B and C. FEN2%: fractional expired concentration of nitrogen.

Figure 1.  Relationship of fractional expired concentration of nitrogen to expired volume during SBN2 test in a non smoker (A), in a GOLD II COPD patient (B) and in a GOLD IV COPD patient (C) who did not exhibit a phase IV (please see text). Perpendicular arrow indicates closing volume (CC). The volume expired from total lung capacity (0 volume) to this arrow is “open capacity” (“OC”). The four phases (I-IV) are indicated. Broken lines: slope of phase III. Note: (1) presence of cardiac oscillations in A but not B and C, and (2) marked increase of slope of phase III in B and C. FEN2%: fractional expired concentration of nitrogen.

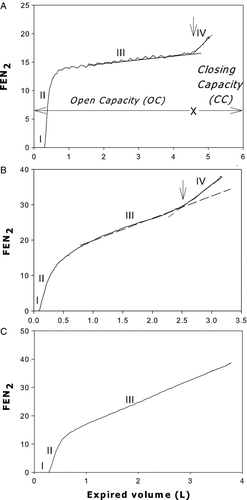
Table 2. Slope of phase III, tidal airway closure, and tidal expiratory flow limitation in seated position in: 10 normal never-smokers, 10 smokers with normal spirometry (group O), and 40 COPD patients stratified according to GOLD12 (GOLD I to GOLD IV).

Figure 2. Relationship of slope of phase III of single-breath N2 test to GOLD stage of 50 seated smokers. Solid line: regression line. Broken line: 100%pred of phase III. Closed circles: mean values. Bars: ± SE. N = normal subjects.

Figure 2.  Relationship of slope of phase III of single-breath N2 test to GOLD stage of 50 seated smokers. Solid line: regression line. Broken line: 100%pred of phase III. Closed circles: mean values. Bars: ± SE. N = normal subjects.

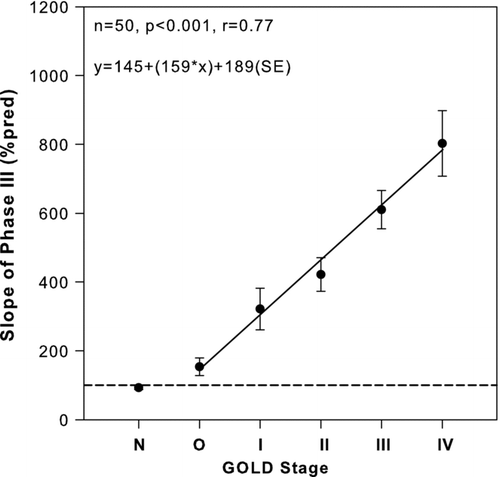
Table 3. Pearson correlation coefficient (r) and coefficients of determination (r2) of slope of phase III (%pred) significant to various respiratory variables shown in Tables 1 and 3

Reprints and Corporate Permissions

Please note: Selecting permissions does not provide access to the full text of the article, please see our help page How do I view content?

To request a reprint or corporate permissions for this article, please click on the relevant link below:

Academic Permissions

Please note: Selecting permissions does not provide access to the full text of the article, please see our help page How do I view content?

Obtain permissions instantly via Rightslink by clicking on the button below:

If you are unable to obtain permissions via Rightslink, please complete and submit this Permissions form. For more information, please visit our Permissions help page.