Figures & data
Table 1. Baseline data (n = 185)
Figure 1. Left panel illustrates data for baseline R5 (median and IQR) obtained in all subjects prior to methacholine administration. Right panel illustrates the bronchodilator response of R5 assessed on a prior day in 117/185 subjects. Baseline R5 and bronchodilator response did not relate to the degree of BHR (p = ns).
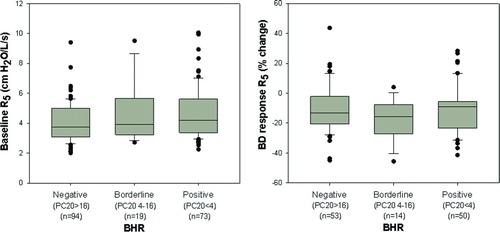
Figure 2. Relationship between degree of BHR and changes in oscillometric parameters during MCT. The top panel illustrates that the change in total airway resistance as assessed by R5 was significantly larger in the positive and borderline BHR groups compared with the negative BHR group (p = 0.025). The bottom two panels illustrate minimal change in R20 during MCT while there was a larger change in distal airway mechanics as assessed by R5–20 (p<0.001 for comparison of R5–20 between positive and borderline vs. negative BHR groups).
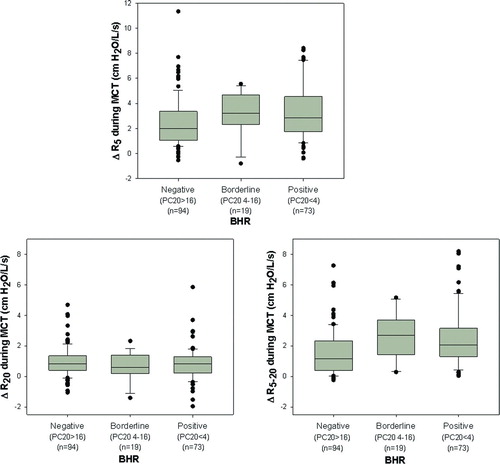
Figure 3. Relationship between change in FEV1 obtained after the highest dose of methacholine with the simultaneous change in R5. Although many of the subjects demonstrated concordant changes in spirometric and oscillometric parameters during MCT, there was disparity between change in FEV1 and change in R5 (r = 0.17, p = 0.019).
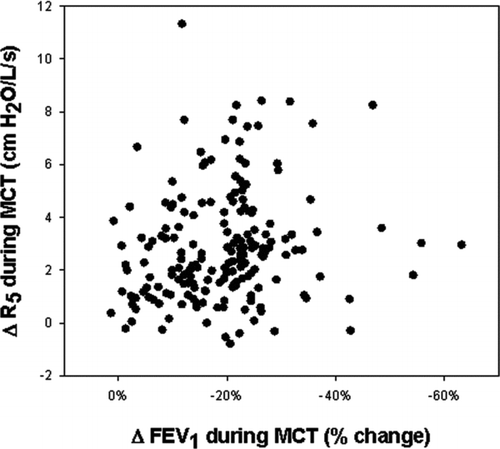
Figure 4. Relationship between the change in R5 during methacholine administration to changes in R20 and frequency dependence of resistance between 5–20 Hz. Analysis of the slopes of these relationships indicated that R20 increased only 0.3 cmH2O/L/s for every 1 cmH2O/L/s change in R5. In contrast, R5–20 increased 0.7 cmH2O/L/s for every 1 cmH2O/L/s change in R5 indicating that the effect of methacholine on resistance at 5Hz was predominantly driven by increased frequency dependence of resistance.
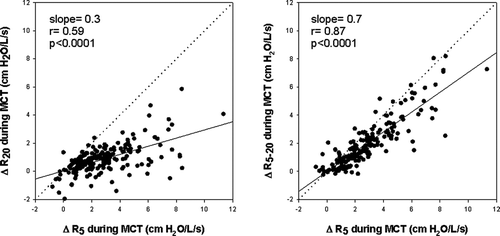
Figure 5. The effect of methacholine on resistance at 5Hz was tightly correlated with the frequency dependence of reactance as assessed by the change in AX.
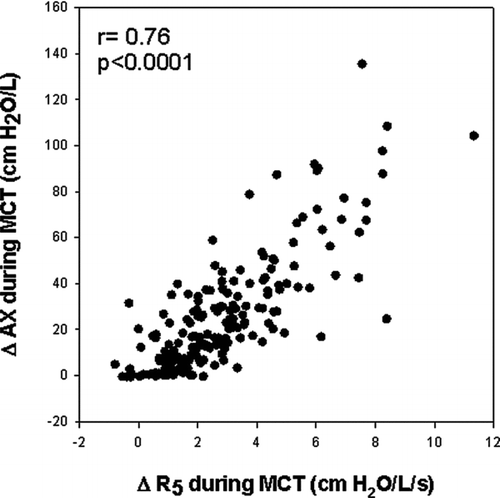
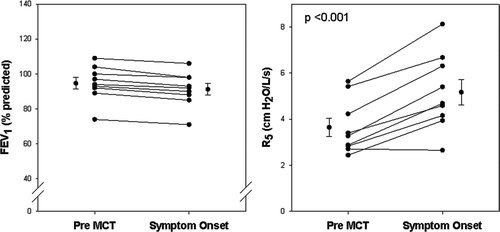
Figure 6. Relationship between onset of respiratory symptoms to changes in airflow and changes in R5. Data are illustrated for the 9/33 subjects who developed symptoms with minimal change in FEV1 (mean change = -3.4%, left panel). The mean increase in R5 was 42% from the baseline value in these subjects (right panel).