Figures & data
Table 1. Clinical characteristics of subjects in this study
Table 2. Serum levels of interleukin (IL)-18, interferon (IFN)-γ and high sensitivity C-reactive protein (hsCRP) in subjects
Figure 1. Serum IL-18 levels in nonsmokers (N) (n = 32), current smokers (S) (n = 30) and stable chronic obstructive pulmonary disease (COPD) patients classified according to Global Initiative for Chronic Obstructive Lung Disease (GOLD) stage I (n = 14), II (n = 15), III (n = 16) and IV (n = 13). *: p<0.05 versus nonsmokers; **: p<0.05 versus current smokers, stable patients with GOLD stage I and II COPD.
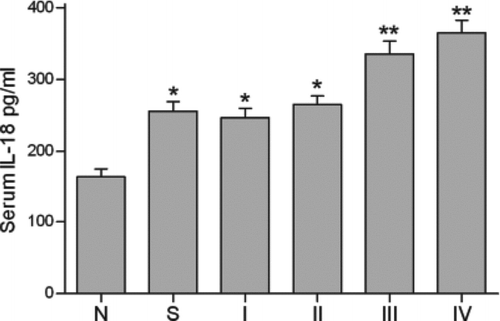
Figure 2. Correlation between serum IL-18 levels and forced expiratory volume in one second (FEV1)% predicted in stable chronic obstructive pulmonary disease patients (n = 58). The gradient and intercept of the best-fit line are -0.1799 and 113.8, respectively (r = 0.5108 and p<0.001).
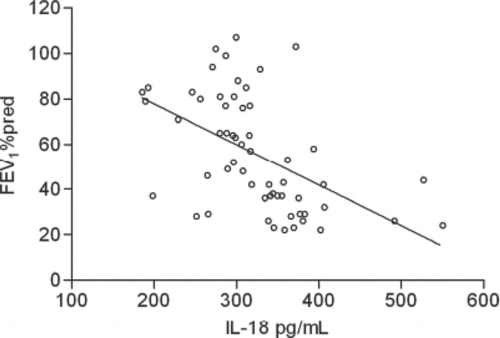
Figure 3. A representative three-color flow cytometric analysis of IL-18Rα expression on CD3+ cells (T lymphocytes) and CD3+CD8+ cells (CD8+ T lymphocytes) in a nonsmoker. The number in each panel indicates a percentage of IL-18Rα-positive cells gated in CD3+ cells or CD3+CD8+ cells.
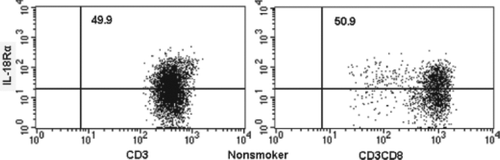
Figure 4. A representative three-color flow cytometric analysis of IL-18Rα expression on CD3+ cells (T lymphocytes) and CD3+CD8+ cells (CD8+ T lymphocytes) in a current smoker. The number in each panel indicates a percentage of IL-18Rα-positive cells gated in CD3+ cells or CD3+CD8+ cells.
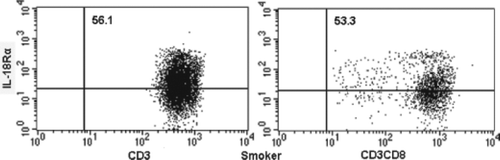
Figure 5. A representative three-color flow cytometric analysis of IL-18Rα expression on CD3+ cells (T lymphocytes) and CD3+CD8+ cells (CD8+ T lymphocytes) in a stable chronic obstructive pulmonary disease patient (COPD). The number in each panel indicates a percentage of IL-18Rα-positive cells gated in CD3+ cells or CD3+CD8+ cells.
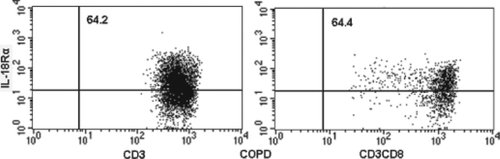
Figure 6. Expression of IL-18Rα on peripheral CD3+ lymphocytes (T lymphocytes). Percentages of IL-18Rα-positive T lymphocytes in flow cytometric analysis are indicated in nonsmokers (N), current smokers (S) and stable chronic obstructive pulmonary disease patients (C). *: p<0.05 versus nonsmokers and current smokers.
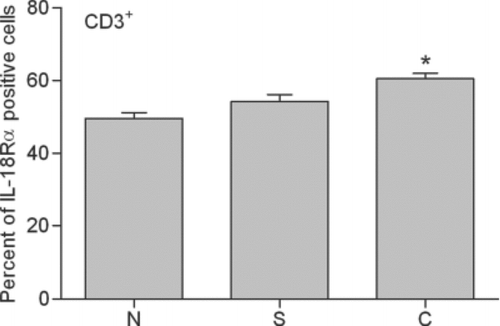
Figure 7. Expression of IL-18Rα on peripheral CD3+CD8+ lymphocytes (CD8+ T lymphocytes). Percentages of IL-18Rα-positive CD8+ T lymphocytes in flow cytometric analysis are indicated in nonsmokers (N), current smokers (S) and stable chronic obstructive pulmonary disease patients (C). *: p<0.05 versus nonsmokers and current smokers.
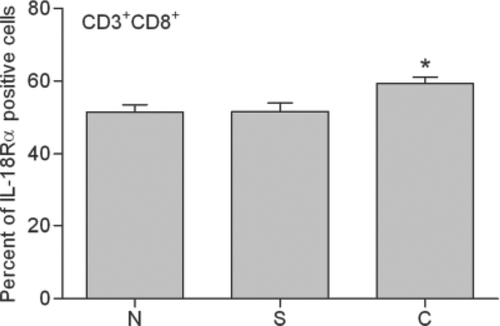
Table 3. The proportion of interleukin (IL)-18R-expressing T lymphocytes and CD8+ T lymphocytes in subjects