667
Views
5
CrossRef citations to date
0
Altmetric
ORIGINAL RESEARCH

Comparing Dynamic Hyperinflation and Associated Dyspnea Induced by Metronome-Paced Tachypnea Versus Incremental Exercise

, , , &

Figures & data

Figure 1.  Protocol for MPT showing timing and sequence of metronome pacing.

Figure 1.  Protocol for MPT showing timing and sequence of metronome pacing.

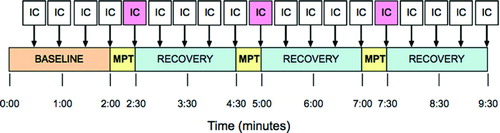
Table 1.  Baseline characteristics of the subjects

Figure 2.  Time course and degree of dynamic hyperinflation produced by MPT. Columns represent mean inspiratory capacity (% predicted) ± SEM for each condition of testing. There is a graded decline in inspiratory capacity with increasing respiratory rates for both I:E ratios. *P < 0.05 for same I:E ratio compared to baseline. P < 0.05 versus same respiratory rate at different I:E ratio.

Figure 2.  Time course and degree of dynamic hyperinflation produced by MPT. Columns represent mean inspiratory capacity (% predicted) ± SEM for each condition of testing. There is a graded decline in inspiratory capacity with increasing respiratory rates for both I:E ratios. *P < 0.05 for same I:E ratio compared to baseline. †P < 0.05 versus same respiratory rate at different I:E ratio.

Table 2.  Change in inspiratory capacity (∆IC) for each condition of MPT

Figure 3.  Degree of dynamic hyperinflation produced by symptom-limited cycle ergometry.

Figure 3.  Degree of dynamic hyperinflation produced by symptom-limited cycle ergometry.

Figure 4.  Degree of dynamic hyperinflation produced by metronome-paced tachypnea and exercise testing.

Figure 4.  Degree of dynamic hyperinflation produced by metronome-paced tachypnea and exercise testing.

Figure 5.  Comparison between DH induced during MPT and XT for two separate patients. Patient 1 demonstrates DH during both MPT and XT; a respiratory rate above 40 breaths/min is achieved during XT. Patient 2 demonstrates DH during MPT but not during XT, which is terminated prematurely due to exhaustion; the highest respiratory frequency reached during XT is only approximately 30 breaths/minute.

Figure 5.  Comparison between DH induced during MPT and XT for two separate patients. Patient 1 demonstrates DH during both MPT and XT; a respiratory rate above 40 breaths/min is achieved during XT. Patient 2 demonstrates DH during MPT but not during XT, which is terminated prematurely due to exhaustion; the highest respiratory frequency reached during XT is only approximately 30 breaths/minute.

Figure 6.  Bland-Altman comparison of DH during MPT and XT. Bland and Altman method plotting the nett difference in decrease in IC versus mean decrease in IC following MPT and exercise testing. There was a bias for a greater decrease in IC following MPT.

Figure 6.  Bland-Altman comparison of DH during MPT and XT. Bland and Altman method plotting the nett difference in decrease in IC versus mean decrease in IC following MPT and exercise testing. There was a bias for a greater decrease in IC following MPT.

Reprints and Corporate Permissions

Please note: Selecting permissions does not provide access to the full text of the article, please see our help page How do I view content?

To request a reprint or corporate permissions for this article, please click on the relevant link below:

Academic Permissions

Please note: Selecting permissions does not provide access to the full text of the article, please see our help page How do I view content?

Obtain permissions instantly via Rightslink by clicking on the button below:

If you are unable to obtain permissions via Rightslink, please complete and submit this Permissions form. For more information, please visit our Permissions help page.