
Figures & data
Figure 1. Characterization of MSCs. (a) Primary fibroblast-like rMSCs was observed. The multipotential differentiation of rMSCs was verified via Oil Red staining for adipocytes, Alizarin S staining for osteoblasts, and toluidine blue staining for chondrocytes. (b) The rMSCs did not express CD11b or CD45, but expressed CD29 and CD90, as measured by flow cytometry. (c) Primary fibroblast-like hMSCs were observed. The hMSCs did not express CD11b/c, CD19, or CD34, but expressed CD44, CD90, and CD105.
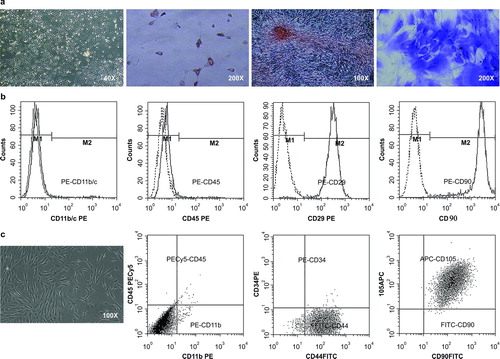
Figure 2. rMSC infusion downregulated pro-inflammatory cytokines levels, while increasing TGF-β1 expression. The levels of IL-1β, IL-6, MCP-1, TNF-α, and TGFβ-1 in lung homogenates and serum were measured by ELISA. Data are shown as the mean ± SD (n = 6). *p < 0.05, **p < 0.01 vs. sham exposed group; #p < 0.05, ##p < 0.01 vs. smoke-exposed group.
Figure 3. rMSC infusion reduced inflammation of peribronchial and alveolar structures. Pulmonary histopathological changes were observed by hematoxylin and eosin staining. The arrows indicate airway and lung inflammation in smoke-exposed rats and reduced inflammatory cells in peribronchial and alveolar structures after rMSC administration.
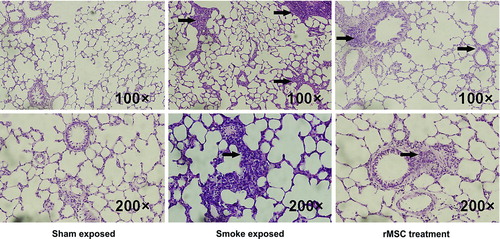
Table 1. The total and differential cell counts of leukocytes in BALF (1 × 10⁸/L)
Table 2. rMSC administration reduced airway obstruction
Figure 4. Evaluation of pro-inflammatory cytokine levels in cell supernatants. Human PBMCs were cultured alone without 5% CSE (control group) or with 5% CSE stimulation (5% CSE group). Recombinant TGFβ-1 (40 ng/mL) was added into cultured PBMCs exposed to 5% CSE(TGFβ-1 group). In addition, PBMCs exposed to 5% CSE were cocultured with hMSCs using a transwell system (hMSCs group) and an anti-TGFβ-1 neutralizing antibody (500 ng/mL) was added into the coculture system (anti-TGFβ-1 group). The cell supernatant was collected to evaluate TNF-α levels (pg/mL) by ELISA. *p < 0.05, **p < 0.01 vs. cultured PBMCs without CSE; ##p < 0.01 vs. cultured PBMCs with CSE; ++p < 0.01 vs. cocultured PBMCs with hMSCs without anti-TGFβ-1 antibody.
Table 3. TGF-β1 levels in different groups