Figures & data
Figure 1. Randomized crossover study design. At visit 1 participants were randomized to oPEP (dark-gray) or baseline care (light-gray) on a 1:1 allocation basis and after 3 or 4 weeks were crossed-over to the other option at visit 2 and evaluated a final time at visit 3. On-Off Treatment (—), participants randomized to oPEP and crossed-over to baseline care; Off-On Treatment (– –), participants randomized to baseline care and crossed-over to oPEP.
Table 1. Subject demographic and baseline measurements
Table 2. Pre- and Post-oPEP measurements
Figure 2. 3He MRI ventilation in representative sputum and non-sputum-producers. Pre- and post-oPEP ventilation (in cyan) registered to 1H anatomical MRI (in grey-scale) for sputum- and non-sputum-producers. Yellow arrows identify regional differences in 3He ventilation post-oPEP. Sputum-producers: S11, 56 year-old female, Δ FEV1 = −11%pred, Δ FVC = −13%pred, Δ 6MWD = −78m, Δ SGRQ = 20, Δ VDP = 6%. S7, 72 year-old female, Δ FEV1 = −6% pred, Δ FVC = −24% pred, Δ 6MWD = −24m, Δ SGRQ = 19, Δ VDP = 4%. S8, 79 year-old female, Δ FEV1 = 2%pred, Δ FVC = 3%pred, Δ 6MWD = −63m, Δ SGRQ = 2, Δ VDP = −3%. Non-sputum-producers: S25, 72 year-old female, Δ FEV1 = −5%pred, Δ FVC = 0%pred, Δ 6MWD = −18m, Δ SGRQ = −3, Δ VDP = 3%. S23, 77 year-old female, Δ FEV1 = −2%pred, Δ FVC = −2%pred, Δ 6MWD = 12m, Δ SGRQ = 2, Δ VDP = 1%. S28, 51 year-old male, Δ FEV1 = −1%pred, Δ FVC = −1%pred, Δ 6MWD = −6m, Δ SGRQ = −11, Δ VDP = −1%.
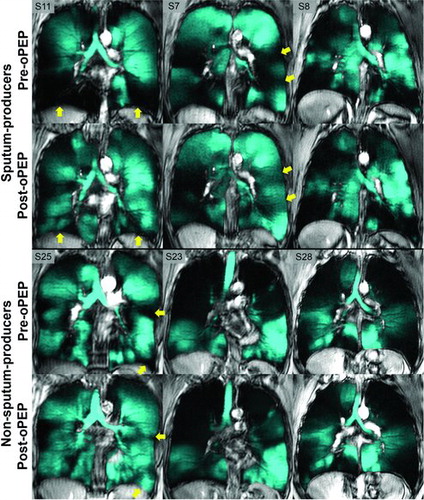
Figure 3. Clinically relevant post-oPEP improvements. Values = n improved ≥ minimum-clinically important-difference (FEV1, 6MWD, SGRQ Total Score), smallest detectable difference (VDP) or 1-point score improvement (PEQ). FEV1, forced expiratory volume in 1 second; 6MWD, 6-minute walk distance; SGRQ, St. George's Respiratory Questionnaire total score; PEQ, Patient Evaluation Questionnaire; VDP, ventilation defect percent; * n = 13 for 6MWD and VDP.
Table 3. Correlations for post-oPEP changes in PEQ Ease-Bringing-Up-Sputum and PEQ Patient-Global-Assessment
Figure 4. Relationships for post-oPEP changes in clinical measurements and change in 3He MRI VDP. Significant relationship for post-oPEP changes in 3He MRI VDP with A) FEV1 (r = −0.50, r2 = 0.25, p = 0.009), and B) PEQ Ease-Bringing-Up-Sputum (r = 0.65, r2 = 0.39, p = 0.0004). Dotted lines = 95% confidence intervals.