Figures & data
Figure 1. Quantification of VPM-to-substratum separation. (A) A Swiss 3T3 cell on the non-coated glass substratum was observed with TIRF microscopy in the presence of B-phycoerythrin. Arrows indicate dark streaks in the cell region. (B) An epi-fluorescence image of the plasma membrane of the same cell as in (A). After the observation of (A), B-phycoerythrin was washed out, and then the plasma membrane was stained with DiI. (C) A TIRF image of the same region as in (B). Arrows indicate bright streaks corresponding to FAs. (D) The map showing the distance between the substratum surface and the VPM of the same cell as in (A–C). The distance was calculated as described in METHODS. The pseudocolor scale in nm is in the right. At FAs, VPM-to-substratum separation was < 25 nm (arrows). Bar, 20 μm.
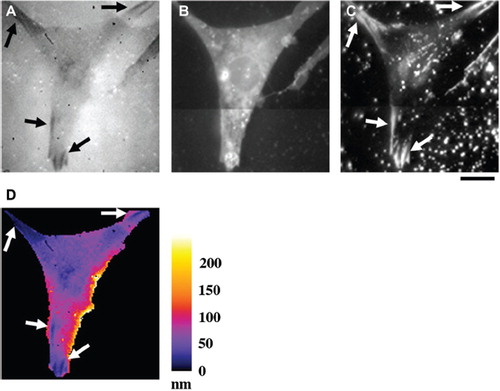
Figure 2. Epi-fluorescence and TIRF observations of FN fibrils. Hs68 human foreskin fibroblasts on the FN-coated glass substratum were fixed and stained for FN. To improve accessibility of antibody molecules to ventral FN fibrils, plasma membranes were permeabilized after the fixation. (A and B) Epi-fluorescence (A) and TIRF (B) images of FN. The dotted line in (A) indicates the cell boundary, and the upper part of the image represents the cell region. The blurred bright region indicated by an arrowhead in (A) represents a FN fibril located on the apical surface of the cell. Bar, 10 μm. (C) Plots of epi-fluorescence (black diamonds) and TIRF (gray squares) intensities along one FN fibril indicated by a double arrowhead in (A and B). Intensities were normalized to the maximum values in the individual plots.
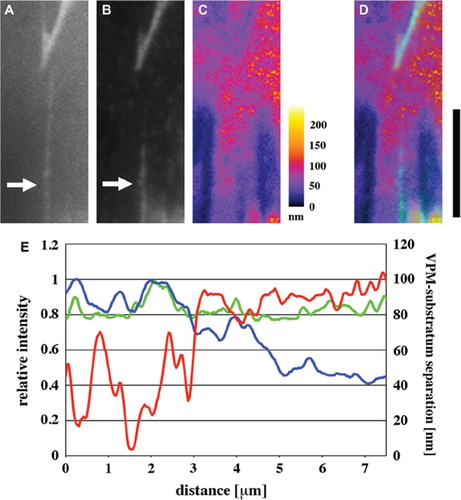
Figure 3. Relationship between VPM-to-substratum separation and FN fibril arrangement. Hs68 human foreskin fibroblasts on the FN-coated glass substratum were fixed, stained for FN without permeabilization, and then observed in the presence of B-phycoerythrin. (A and B) Epi-fluorescence (A) and TIRF (B) images of FN. Arrows indicate the FN fibril only partially visible in the TIRF image. (C) The map showing the distance between the substratum surface and the VPM of the same region as in (A and B). (D) A merged image of (B) and (C). The regions where FN fibrils could be observed with TIRF microscopy are in cyan. Bar, 10 μm. (E) Plots of VPM-to-substratum separation (red line; right scale) and epi-fluorescence (green line) and TIRF (blue line) intensities of FN (left scale) along one FN fibril indicated by arrows in (A and B). Fluorescence intensities were normalized to the maximum values in the individual plots.