Figures & data
Figure 1. Representative fluorescence profiles of local mechanical stimulation-induced Ca2 + responses. Site of stimulation is marked by an asterisk on cell 1. To exclude the possibility that soluble factors released due to mechanical stimulation may induce a Ca2 + increase, a counter perfusion flow of the extracellular medium was applied. The direction of the flow is indicated above the fluorescence images. Time of stimulation is indicated by an arrow. (A) In A7r5 cells stimulation evoked a Ca2 + increase in the stimulated cell (cell 1) that failed to propagate to neighboring cells. In pSMCs (B) and 6B5N cells (C), the Ca2 + transient evoked in the stimulated cell propagated to neighboring cells. Scale bars, 25 μm. (D) A data summary of average peak fluorescence amplitude of the Ca2 + rise in neighboring cells relative to the Ca2 + rise in the stimulated cell.
Figure 2. Effects of GJ inhibitors on the propagation of Ca2 + wave in pSMCs and 6B5N cells. The same cell (cell 1) is stimulated before and after inhibitors were applied. Carbenoxolone (CBX) (A) remarkably diminished, whereas octanol (B) blocked the propagation of Ca2 + waves to neighboring cells. Scale bars, 25 μm.
Figure 3. Quantification of GJ dye-coupling by intercellular Lucifer Yellow diffusion. (A) Scrape-loading and dye transfer of LY (yellow) in A7r5, pSMCs and 6B5N cells (nuclei in blue). The vertical line in the middle of the image is the mark of the scalpel blade used for scrape-loading. Scale bars, 200 μm. (B) Plot of average LY fluorescence intensity in each pixel along the rows within the images in (A). (C) The distance of LY diffusion was quantified by taking the full width at half maximum (FWHM) of the plots in (B) divided by the square root of the average cell area. The spread of LY in pSMCs was significantly higher than in A7r5 cells and similar as in 6B5N cells.
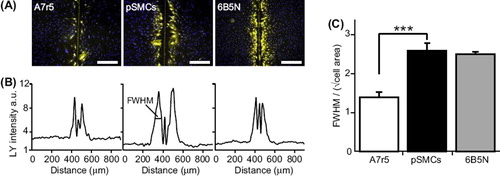
Figure 4. Expression of Cx43 and Cx40. RT-PCR analysis of Cx mRNA expression (A) in A7r5 and pSMCs cells demonstrates a higher expression of Cx43 in pSMCs than in A7r5 cell, and the absence of Cx40 in pSMCs. The mean value of A7r5 cells, control, is presented as 1. Western blot analysis in (B) and densitometric analysis of Cx protein levels in (C) also showed the higher expression of Cx43 and the absence of Cx40 in pSMCs. 6B5N cells express the same amount of Cx43, but lower Cx40 compared to A7r5 cells. Densitometric data were normalized to A7r5 cells, separately for each connexin type.
Figure 5. Distribution patterns and interaction of Cx43 and Cx40 in A7r5, pSMCs and 6B5N cells. In A7r5 cells (A, upper row) Cx43 (green) was rarely localized at the site of cell–cell contact (arrows in A, upper row right). Most of the Cx43 was localized in the cytoplasm. PSMCs (A, middle row) showed punctate patterns of Cx43 immunoreactivity at the regions of cell–cell contact corresponding to gap junction plaques (nuclei in blue). In 6B5N cells (A, bottom row) distinct Cx43 immunoreactivity was detectable at the regions of cell–cell contact with fewer Cx43 in the cytoplasm compared to A7r5 cells. Scale bars, 50 μm. In (B) lysates of cell samples (A7r5, pSMCs, and 6B5N) were incubated either with specific antibodies against Cx40 (lanes IP Cx40) or Cx43 (lanes IP Cx43). Complexes were immunoprecipitated (IP) and analyzed by Western blot (WB) using Cx43 (B, upper panel) or Cx40 antibodies (B, lower panel). The input lanes represent the whole cell lysate before immunoprecipitation (positive controls). Immunoprecipitation with irrelevant antibodies (antibodies against NFκB-P65, lane IP P65) or in the absence of antibodies (lane no. Ab) represent negative controls. An interaction between Cx43 and Cx40 was observed in A7r5 and 6B5N cells, but not in pSMCs, since they do not express Cx40.
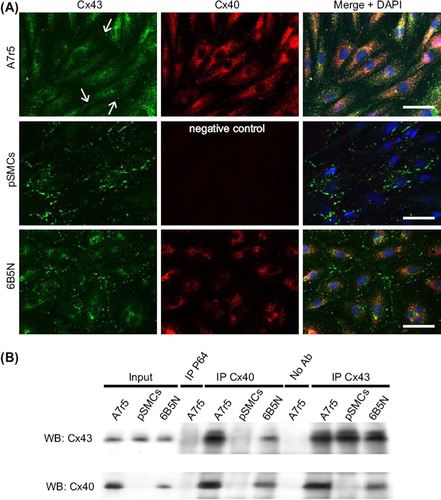
Figure 6. Detection of interactions between Cx43 and Cx40 in A7r5 and 6B5N cells. For the visualization of the direct protein interaction between Cx43 and Cx40, the fixed cells were incubated in the presence of two primary antibodies directed against Cx43 and Cx40. Two secondary antibodies, to which oligonucleotides were attached, allowed the detection of the target proteins. As Cx43 is in proximity of Cx40, the attached oligonucleotides constitute a template to form a circular DNA molecule, which was amplified to form a bundle of DNA detected by a Texas-Red-labeled probe (red spots). Top row in (A) shows in situ ligation assay for Cx43 and Cx40 in A7r5 and 6B5N (nuclei in blue). Scale bar: 30 μm. The insets are zooms of the area in white square and indicate that Cx43–Cx40 interactions in A7r5 cells are mainly located in the cytosol whereas in 6B5N, Cx43 interacts with Cx40 mainly at the regions of cell–cell contact. Scale bar: 15 μm. The bottom row in (A) represents negative controls for in situ ligation assay performed by incubation with only one of the following antibodies: the Cx43 antibodies (left) or the Cx40 antibodies (right) (representative from 3 independent experiments). (B) Quantification of the number of Cx43–Cx40 interactions in each cell type illustrating that Cx43 is significantly less bound to Cx40 in 6B5N compared to A7r5.
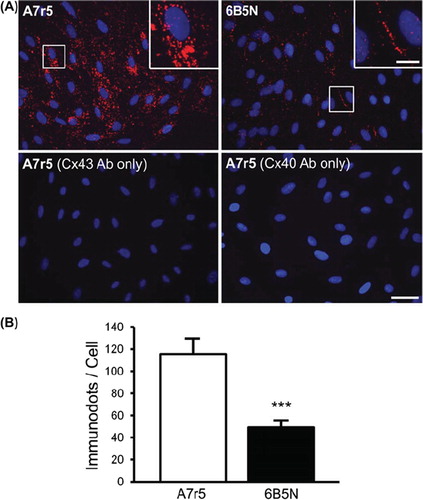
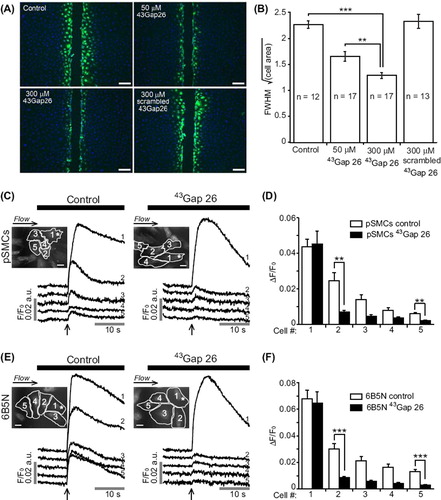
Figure 7. Effects of connexin-mimetic peptide 43Gap 26 on gap junctional-coupling. (A) Scrape-loading and dye transfer of LY (green, nuclei in blue) in 6B5N cells in the presence of the Cx43 gap junction inhibitor 43Gap 26 and it's scrambled version. Scale bars, 100 μm. 43Gap 26 significantly decreased LY diffusion to neighboring cells. The scrambled 43Gap 26 was used as a negative control to test the specificity of the effect of 43Gap 26 (A and B). LY diffusion in the presence of scrambled 43Gap 26 was similar to control (p = 0.66). Experiments on the left panel in (C and E) are time-matched controls, whereas, the right panel shows experiments performed after 40 minutes incubation in buffer solution supplemented with 43Gap 26. 43Gap 26 significantly diminished the propagation of Ca2 + waves to neighboring cells in both pSMCs (C) and 6B5N cells (E). Scale bars, 25 μm. Change in fluorescence ratio (ΔF/F0) in control compared to 43Gap 26 treated cells are summarized in (D) for pSMCs and in (F) for 6B5N cells.