1,050
Views
5
CrossRef citations to date
0
Altmetric
RESEARCH ARTICLE

Involvement of retrotransposon L1 in stemness and cellular plasticity

, , , , , , & show all
Pages 1-7 | Received 14 Apr 2014, Accepted 24 Sep 2014, Published online: 20 Oct 2014

Figures & data

Figure 1. Determining expression of L1 ORF1 and L1 ORF2. The presence of L1 ORF1 and L1 ORF2 mRNA was determined in CSCs, cancer cell lines, and non-cancerous (normal) samples. Expression of 18SrRNA was used as control. All reactions were performed in triplicates. The estimated length of PCR products is L1-ORF1: 187bp, L1-ORF2: 137bp, and 18srRNA: 112bp.
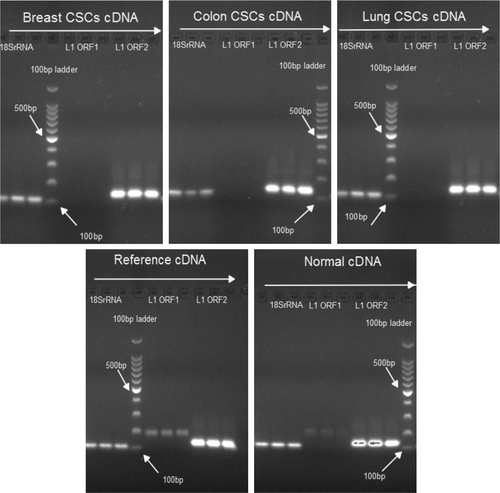
Figure 1. Determining expression of L1 ORF1 and L1 ORF2. The presence of L1 ORF1 and L1 ORF2 mRNA was determined in CSCs, cancer cell lines, and non-cancerous (normal) samples. Expression of 18SrRNA was used as control. All reactions were performed in triplicates. The estimated length of PCR products is L1-ORF1: 187bp, L1-ORF2: 137bp, and 18srRNA: 112bp.

Figure 2. Study of EMT–MET markers. The figure presents the qPCR data from CSCs, the respective cancer cell lines, reference cancer sample, and non-cancer samples. 18SrRNA served as a housekeeping gene in analysis. A lower ΔCt indicates higher gene expression.
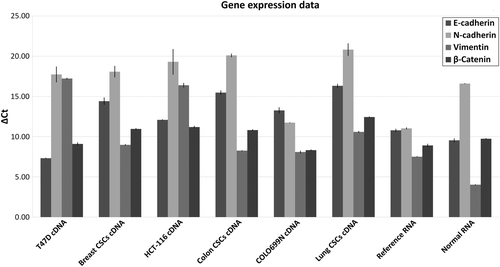
Figure 2. Study of EMT–MET markers. The figure presents the qPCR data from CSCs, the respective cancer cell lines, reference cancer sample, and non-cancer samples. 18SrRNA served as a housekeeping gene in analysis. A lower ΔCt indicates higher gene expression.

Figure 3. Gene expression of stemness transcription factors. The figure presents the qPCR data before and after the knockdown of L1 ORF2. The control sample is the same cell line before siRNA transfection. Samples were normalized to control sample using Livak analysis, while 18SrRNA was used as housekeeping gene. The percentage knockdown of L1 ORF2 was up to 89%.
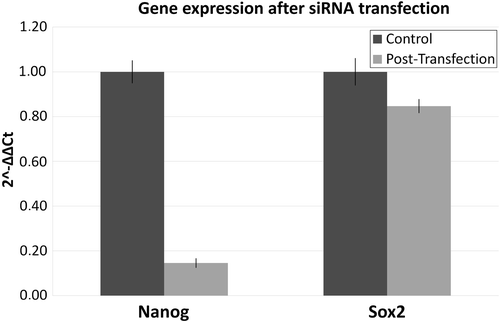
Figure 3. Gene expression of stemness transcription factors. The figure presents the qPCR data before and after the knockdown of L1 ORF2. The control sample is the same cell line before siRNA transfection. Samples were normalized to control sample using Livak analysis, while 18SrRNA was used as housekeeping gene. The percentage knockdown of L1 ORF2 was up to 89%.

Figure 4. Gene expression of EMT–MET markers after knockdown of L1 ORF2. The figure presents the qPCR data before and after the knockdown of L1 ORF2. Samples were normalized to control sample using Livak analysis and 18SrRNA was used as housekeeping gene. The positive values represent increased gene expression, while a negative value decreased gene expression.
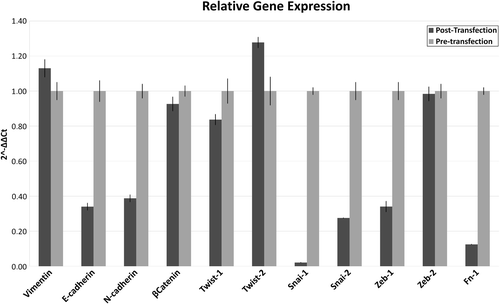
Figure 4. Gene expression of EMT–MET markers after knockdown of L1 ORF2. The figure presents the qPCR data before and after the knockdown of L1 ORF2. Samples were normalized to control sample using Livak analysis and 18SrRNA was used as housekeeping gene. The positive values represent increased gene expression, while a negative value decreased gene expression.

Table 1. Cell cycle distribution.

Table 2. Primer sequences.

Reprints and Corporate Permissions

Please note: Selecting permissions does not provide access to the full text of the article, please see our help page How do I view content?

To request a reprint or corporate permissions for this article, please click on the relevant link below:

Academic Permissions

Please note: Selecting permissions does not provide access to the full text of the article, please see our help page How do I view content?

Obtain permissions instantly via Rightslink by clicking on the button below:

If you are unable to obtain permissions via Rightslink, please complete and submit this Permissions form. For more information, please visit our Permissions help page.