Figures & data
Figure 1. R(+)Methanandamide induces IL-6 secretion and reduces cell viability in tumor prostate PC3 cells. PC3 cells were incubated with different doses of R(+)methanandamide (MET) for 48 h after which cell viability was assayed by MTT (A) or IL-6 was measured using ELISA of the cell culture supernatant (B). Controls received medium/vehicle only. Data are the mean ± SE of three different experiments, each performed in triplicate. All values shown are based on relative value compared to control value (i.e., set at 100% for comparative purposes; cell viability control value = 0.249 absorbance units and IL-6 control value = 113 pg/mL). Statistical analysis was performed by Student’s t-test. (*P < 0.01 vs. control).
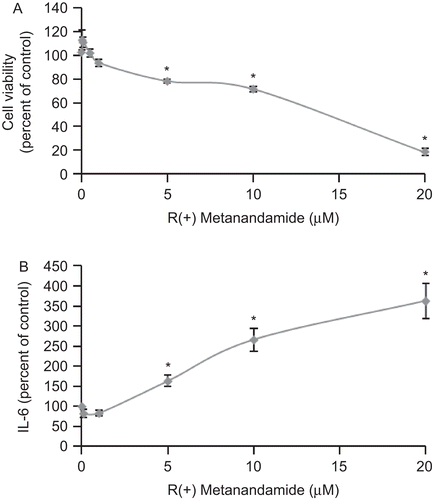
Figure 2. MET induces IL-6 secretion and reduces cell viability: Involvement of CB2 receptor. PC3 cells were treated with 10 μM MET for 48 h in the presence of the CB1 antagonist SR 141716 (SR1) at 1 μM, the CB2 antagonist SR 144528 (SR2) at 2 μM, or the TRPV1 antagonist capsazepine (CPZ) at 1 μM and cell viability was assayed by MTT (A) or IL-6 was measured using ELISA in the cell supernatant (B). Data are the mean ± SE of three different experiments, each performed in triplicate. All values shown are based on relative value compared to control value (i.e., set at 100% for comparative purposes; cell viability control values [from left to right] were 0.323, 0.249, and 0.267 absorbance units and IL-6 control values [from left to right] were 145, 172, and 136 pg/mL). Statistical analysis was performed by Student’s t-test. (*P < 0.01 vs. control; #P < 0.01 vs. MET-treated cells).
![Figure 2. MET induces IL-6 secretion and reduces cell viability: Involvement of CB2 receptor. PC3 cells were treated with 10 μM MET for 48 h in the presence of the CB1 antagonist SR 141716 (SR1) at 1 μM, the CB2 antagonist SR 144528 (SR2) at 2 μM, or the TRPV1 antagonist capsazepine (CPZ) at 1 μM and cell viability was assayed by MTT (A) or IL-6 was measured using ELISA in the cell supernatant (B). Data are the mean ± SE of three different experiments, each performed in triplicate. All values shown are based on relative value compared to control value (i.e., set at 100% for comparative purposes; cell viability control values [from left to right] were 0.323, 0.249, and 0.267 absorbance units and IL-6 control values [from left to right] were 145, 172, and 136 pg/mL). Statistical analysis was performed by Student’s t-test. (*P < 0.01 vs. control; #P < 0.01 vs. MET-treated cells).](/cms/asset/a76f681b-8ff5-44cf-91be-95c0f55a3a6b/iimt_a_424343_f0002_b.gif)
Figure 3. MET induces ceramide biosynthesis in prostate PC3 cells. (A) PC3 cells were incubated with different doses of MET for 48 h and the intracellular content of ceramide was measured according to the Materials and Methods section. Controls received medium/vehicle only; control value = 960 pmol/mg protein. (B) PC3 cells were incubated with 5 μM or 10 μM MET in the presence of 50 μM Fumonisin B1 or 5 μM D609 and intracellular content of ceramide was measured. Controls received medium/vehicle only; control value = 1110 pmol/mg protein. Data are the mean ± SE of three different experiments, each performed in duplicate and are expressed as pmol ceramide/mg total protein. All values shown are based on relative value compared to control value (i.e., set at 100% for comparative purposes). Statistical analysis was performed by Student’s t-test. (*P < 0.01 vs. control; #P < 0.01 vs. MET-treated cells; **p<0.05 vs. control).
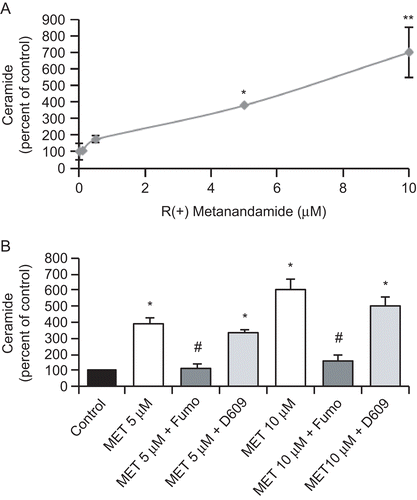
Figure 4. The cannabinoid receptor CB2 is involved in MET-induced ceramide accumulation. PC3 cells were incubated with 10 μM MET in the presence of the CB1 antagonist SR 141716 (SR1) at 1 μM, the CB2 antagonist SR 144528 (SR2) at 2 μM, or the TRPV1 antagonist capsazepine (CPZ) at 1 μM and intracellular content of ceramide was measured. Controls received medium/vehicle only; control value = 836 pmol/mg protein. Data are the mean ± SE of three different experiments performed in duplicate and are expressed as pmol ceramide/mg total protein. All values shown are based on relative value compared to control value (i.e., set at 100% for comparative purposes). Statistical analysis was performed by Student’s t-test. (*P < 0.01 vs. control; #P < 0.01 vs. MET-treated cells).
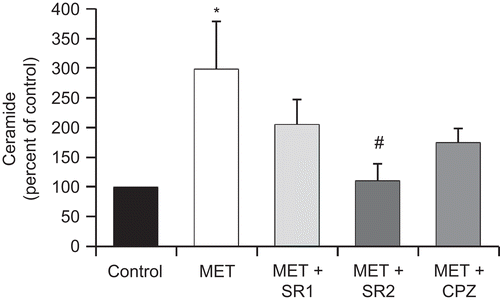
Figure 5. MET-induced ceramide biosynthesis is involved in the anti-proliferative effect but not in the induced secretion of IL-6. PC3 cells were incubated with 10 μM MET in the presence of 50 μM Fumonisin B1. Cell viability was then assayed by MTT (A) and IL-6 in the culture supernatant was measured using ELISA (B). Data are the mean ± SE of three different experiments, each performed in triplicate. All values shown are based on relative value compared to control value (i.e., set at 100% for comparative purposes; cell viability control value = 0.210 absorbance units and IL-6 control value = 119 pg/mL). Statistical analysis was performed by Student’s t-test. (*P < 0.01 vs. control; #P < 0.01 vs. MET-treated cells).
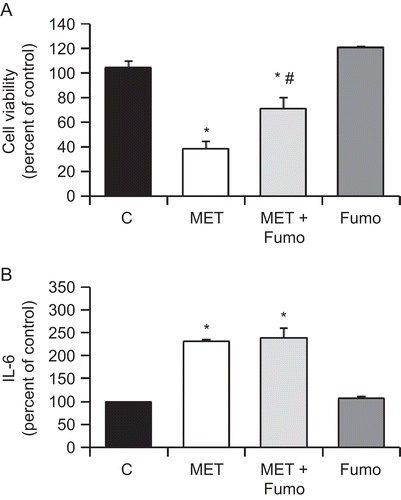
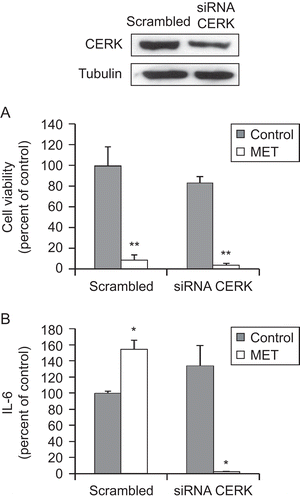
Figure 6. Ceramide kinase is involved in the MET-induced IL-6 secretion by prostate PC3 cells. PC3 cells were transfected (for 72 h) with specific CERK siRNA or control scrambled RNA and then incubated with 10 μM MET for 48 h. Upper panel shows a representative immunoblot of the CERK expression in cell extracts after transfection of the PC3 cells with control scrambled RNA or specific CERK siRNA. Cell viability was then assayed by MTT (A) and IL-6 in the culture supernatant was measured using ELISA (B). Data are the mean ± SE of two different experiments, each performed in duplicate. All values shown are based on relative value compared to control value (i.e., set at 100% for comparative purposes; cell viability control value = 0.340 absorbance units and IL-6 control value = 210 pg/mL). Statistical analysis was performed by Student’s t-test. (*P < 0.01 vs. control; **P < 0.05 vs. control).
