1,167
Views
84
CrossRef citations to date
0
Altmetric
Original Article

Kupffer cell activation by ambient air particulate matter exposure may exacerbate non-alcoholic fatty liver disease

, , , , , , , & show all
Pages 266-275 | Received 08 Jul 2009, Accepted 07 Aug 2009, Published online: 12 Nov 2009

Figures & data

Figure 1. Histological analysis of formalin-fixed sections from C57BL/6 mice exposed to FA or CAPs. H&E staining demonstrated that mice fed NC did not develop fatty livers or hepatic inflammation regardless of exposure to FA (A) or PM (B). Mice receiving HFC and exposed to FA had fatty livers with minimal hepatic inflammation (C); whereas CAPs-exposed mice on HFC developed fatty livers with increased hepatic inflammation (as noted by arrows) (D). F4/80 macrophage staining was less significant in HFC mice exposed to FA (E) versus CAPs (F). Sirius red staining of collagen deposition in mice fed HFC was slightly less in mice exposed to FA (G) versus CAPs (H). For each panel, a representative image is shown. Bars represent 10 μm.
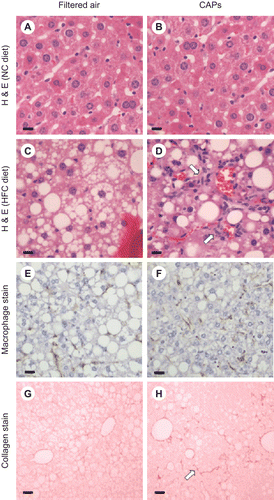
Figure 1.  Histological analysis of formalin-fixed sections from C57BL/6 mice exposed to FA or CAPs. H&E staining demonstrated that mice fed NC did not develop fatty livers or hepatic inflammation regardless of exposure to FA (A) or PM (B). Mice receiving HFC and exposed to FA had fatty livers with minimal hepatic inflammation (C); whereas CAPs-exposed mice on HFC developed fatty livers with increased hepatic inflammation (as noted by arrows) (D). F4/80 macrophage staining was less significant in HFC mice exposed to FA (E) versus CAPs (F). Sirius red staining of collagen deposition in mice fed HFC was slightly less in mice exposed to FA (G) versus CAPs (H). For each panel, a representative image is shown. Bars represent 10 μm.

Table 1. NAFLD grading and staging in C57BL/6 mice fed high fat chow.

Figure 2. Examination of PM in liver sections. Following injection of PM, fine particles < 2 μm are observed in the cytosol of hepatic macrophages, primarily Kupffer cells as seen under high power (40X objective) in H&E-stained formalin-fixed sections (A and B; arrows mark PM; bar represents 10 μm). Similar PM was observed in hepatic macrophages following CAPs exposure (C and D; arrows mark PM; bar represents 10 μm). Imaging of glutaraldehyde-fixed sections by electron microscopy also identified electron dense fine PM in both livers (E) and lungs (F) of mice following exposure to ambient CAPs (arrows mark PM; bar represents 2 μm). Electron dispersive spectroscopy of the electron dense intracellular particles revealed sulfur (S), chlorine (Cl), and bromine (Br) in the liver (G) and lead (Pb) and bromine (Br) in the lung (H). The osmium (Os) peaks indicate deposition of osmium tetroxide, which is used to fix membranes. Copper (Cu) peaks are from the copper grid used to mount the tissue section. (Counts = electron counts, KeV = kilovolts.) For each panel, a representative image is shown.
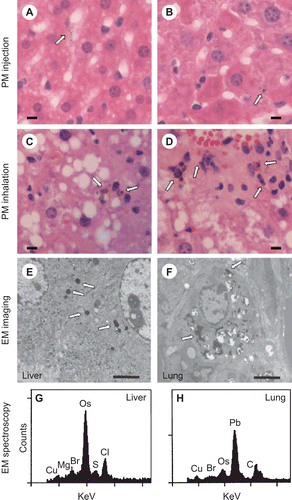
Figure 2.  Examination of PM in liver sections. Following injection of PM, fine particles < 2 μm are observed in the cytosol of hepatic macrophages, primarily Kupffer cells as seen under high power (40X objective) in H&E-stained formalin-fixed sections (A and B; arrows mark PM; bar represents 10 μm). Similar PM was observed in hepatic macrophages following CAPs exposure (C and D; arrows mark PM; bar represents 10 μm). Imaging of glutaraldehyde-fixed sections by electron microscopy also identified electron dense fine PM in both livers (E) and lungs (F) of mice following exposure to ambient CAPs (arrows mark PM; bar represents 2 μm). Electron dispersive spectroscopy of the electron dense intracellular particles revealed sulfur (S), chlorine (Cl), and bromine (Br) in the liver (G) and lead (Pb) and bromine (Br) in the lung (H). The osmium (Os) peaks indicate deposition of osmium tetroxide, which is used to fix membranes. Copper (Cu) peaks are from the copper grid used to mount the tissue section. (Counts = electron counts, KeV = kilovolts.) For each panel, a representative image is shown.

Figure 3. PM effect on cytokine mRNA levels in cultured macrophages. IL-6 mRNA levels were increased in murine RAW macrophages (black bars) at both 8 hr (A) and 24 hr (B) after PM addition. Antibody blockade of TLR4 (white bars) inhibited the effect of PM on IL-6 mRNA levels. Isotype control antibody was present in other cultures (same black bars). Macrophage IL-12 and TNFα mRNA levels were more modestly increased by PM exposure after 24 hr (C). White bars, no PM, light gray bars, 100 μg/ml PM, dark gray bars, 200 μg/ml PM. The results are based on at least three independent experiments. *Statistically significant differences (P < 0.050).
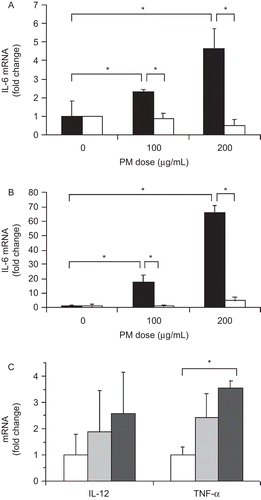
Figure 3.  PM effect on cytokine mRNA levels in cultured macrophages. IL-6 mRNA levels were increased in murine RAW macrophages (black bars) at both 8 hr (A) and 24 hr (B) after PM addition. Antibody blockade of TLR4 (white bars) inhibited the effect of PM on IL-6 mRNA levels. Isotype control antibody was present in other cultures (same black bars). Macrophage IL-12 and TNFα mRNA levels were more modestly increased by PM exposure after 24 hr (C). White bars, no PM, light gray bars, 100 μg/ml PM, dark gray bars, 200 μg/ml PM. The results are based on at least three independent experiments. *Statistically significant differences (P < 0.050).
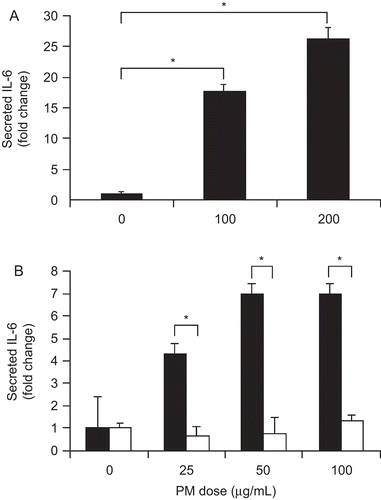
Figure 4. PM effect on cultured macrophage and Kupffer cell IL-6 protein secretion. PM addition significantly increased mouse macrophage cell line IL-6 secretion after 24 hr (A). PM stimulated IL-6 secretion by isolated WT Kupffer cells (black bars) but not TLR4−/− Kupffer cells (white bars) after 24 hr (B). The results are based on at least three independent experiments. *Statistically significant differences (P < 0.050).
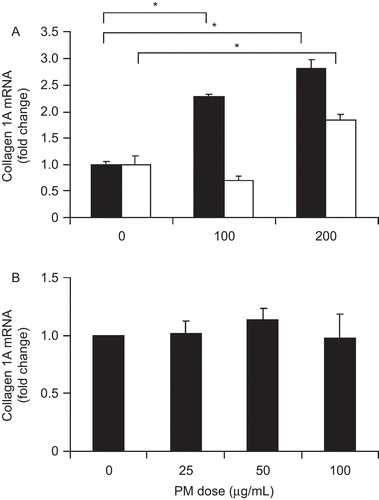
Figure 4.  PM effect on cultured macrophage and Kupffer cell IL-6 protein secretion. PM addition significantly increased mouse macrophage cell line IL-6 secretion after 24 hr (A). PM stimulated IL-6 secretion by isolated WT Kupffer cells (black bars) but not TLR4−/− Kupffer cells (white bars) after 24 hr (B). The results are based on at least three independent experiments. *Statistically significant differences (P < 0.050).

Figure 5. PM effect on cultured stellate cells. Collagen 1A mRNA levels in both WT (black bars) and TLR4−/− (white bars) hepatic stellate cells were increased by exposure to conditioned media from macrophages exposed to PM (A). Direct PM exposure had no significant effect on collagen 1A mRNA expression (B). The results are based on at least three independent experiments. *Statistically significant differences (P < 0.050).

Figure 5.  PM effect on cultured stellate cells. Collagen 1A mRNA levels in both WT (black bars) and TLR4−/− (white bars) hepatic stellate cells were increased by exposure to conditioned media from macrophages exposed to PM (A). Direct PM exposure had no significant effect on collagen 1A mRNA expression (B). The results are based on at least three independent experiments. *Statistically significant differences (P < 0.050).

Figure 6. Dissemination of ambient PM2.5 and activation of tissue macrophages. Ambient PM2.5 may stimulate alveolar macrophage activation and IL-6 production. Soluble PM2.5 may then enter the circulation and enhance tissue macrophage production of pro-inflammatory cytokines and chemokines. In arteries, this process may enhance the progression of atherosclerosis while in liver the progression of NAFLD may be accelerated.
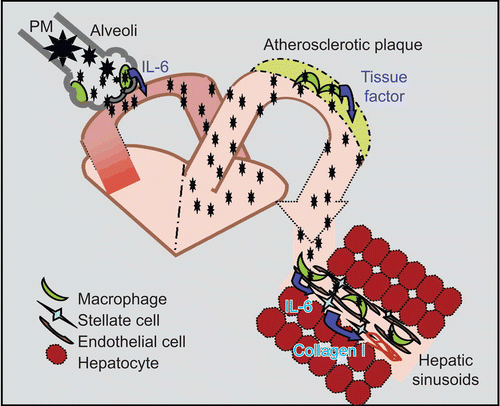
Figure 6.  Dissemination of ambient PM2.5 and activation of tissue macrophages. Ambient PM2.5 may stimulate alveolar macrophage activation and IL-6 production. Soluble PM2.5 may then enter the circulation and enhance tissue macrophage production of pro-inflammatory cytokines and chemokines. In arteries, this process may enhance the progression of atherosclerosis while in liver the progression of NAFLD may be accelerated.

Reprints and Corporate Permissions

Please note: Selecting permissions does not provide access to the full text of the article, please see our help page How do I view content?

To request a reprint or corporate permissions for this article, please click on the relevant link below:

Academic Permissions

Please note: Selecting permissions does not provide access to the full text of the article, please see our help page How do I view content?

Obtain permissions instantly via Rightslink by clicking on the button below:

If you are unable to obtain permissions via Rightslink, please complete and submit this Permissions form. For more information, please visit our Permissions help page.