Figures & data
Figure 1. Dose−response curves of the three reference PBMC after stimulation with CMV pp65. The cryopreserved cells were thawed and processed under serum free conditions and plated at 4 × 10⁵ cells per well into an IFNγ ELISPOT assay. CMV peptide pp65 was titrated as specified. One well was tested at each peptide concentration. The number of spots induced is shown for each concentration and each sample.
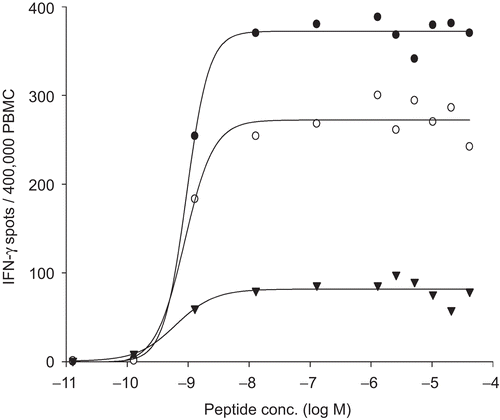
Figure 2. Relationship between PBMC number plated and IFNγ spots induced by peptide CMV pp65 in the reference PBMC. The three cryopreserved reference sample PBMC LP-51 (A) LP-37(B) LP-58(C) were thawed and plated in the specified cell numbers per well, in quadruplicate wells. Peptide CMV pp65 was added to each well at 0.1 μg/mL. The mean and standard deviation for each cell number is specified. The regression line was calculated for 4 × 10⁵ to 5 × 10⁴ PBMC per well (red line), with the correlation coefficient shown.
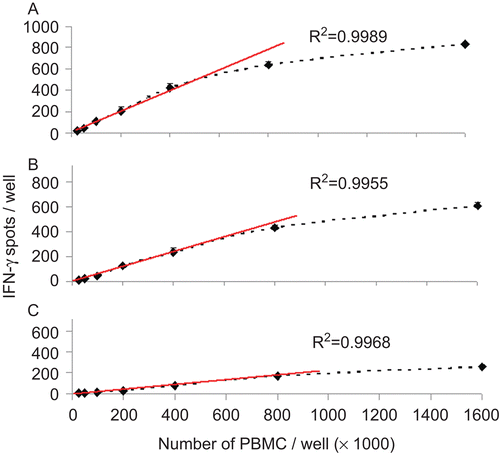
Figure 3. Upper detection limit of IFNγ spot counting. Representative images are shown for data obtained with LP-51 when tested at the cell numbers specified. The test conditions are as described in . The top row shows the raw images, the bottom row the spot counts with the overlay of the counted spots over the raw image; the green outlines are generated by the ImmunoSpot software to mark spots that have been automatically recognized/counted by the software. The data illustrate how individual spots can be discretely discerned up ≈ 500 spots per well. Note also the linearity of the counts in . At higher numbers, confluence of spots and ELISA effects interfere with the countability of the data.
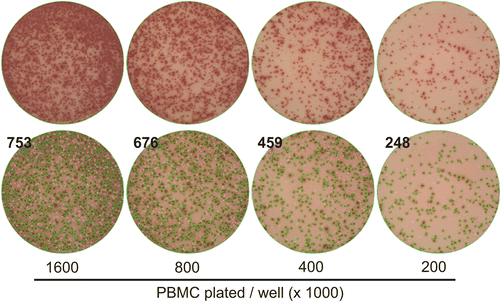
Figure 4. Intra-laboratory reproducibility of data under GLP conditions. The three reference samples as specified by shading were tested in three independent experiments by a single individual (A) or by three different individuals, whereby each of them thawed and processed the cells independently (B). In (C), the cells were thawed in a separate experiment and processed by a single individual and subsequently split into three identical aliquots for handling by three independent investigators. The results obtained by each individual are represented by the grey bars (with the SD for triplicate wells) shown; the mean ± SD of the three independently-obtained data points are specified by the black bar. All the data were obtained in the Reference Laboratory while testing under GLP-compliant conditions.
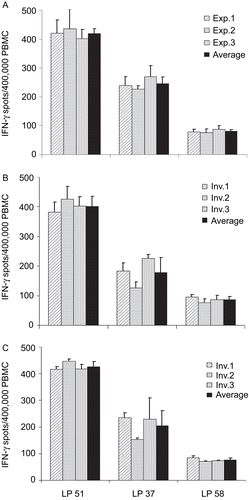
Figure 5. Inter-laboratory variability of the test results. Three reference samples shown in the left three panels (A: LP-51, B: LP-37, C: LP-58) were tested independently in eight different laboratories following identical protocols and using identical reagents, including the use of serum free media. Each dot on the right represents the test result obtained by one of these laboratories, with the mean for all laboratories shown by the red bar. The results of the individual tests performed in the Reference Laboratory (from , , and ) are represented by the dots on the right, with the mean shown by the red bar (representing the Reference Value for this study), and ± 3 SD shown by the hatched red line. Panel D shows the ranking hierarchy, whereby the results obtained by each laboratory are represented by a different color and are connected by a line in that color.
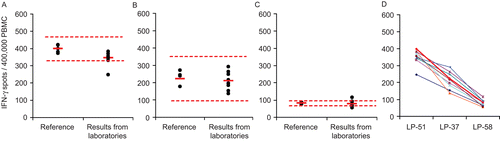
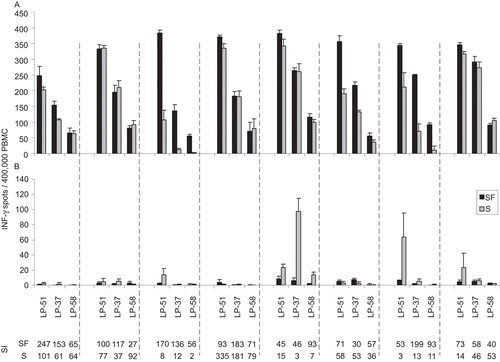
Figure 6. Assay performance in serum free test conditions versus serum-containing media. All participating laboratories tested the PBMC reference samples in serum free CTL-Test™ medium (SF, the black bars) or with the serum of their choice (S, the grey bars—these media contained 10% of the respective serum plus 1% L-glutamine in RPMI 1640). Panel (A) shows the CMV pp 65-induced spot counts. Panel (B) shows the spot counts in the respective media alone. In each of the panels, the data for the three reference PBMC (as specified) are grouped per laboratory being separated by the hatched line. Thus, within each hatched line a different serum was tested. Means (±1SD) are shown for each test condition done in quadruplicate wells. The last two rows show the stimulation index (SI) for each test condition serum-free or with the respective serum. SI was calculated as spot counts induced by antigen divided by spot count in the medium control. The data in this graph for the SF media are the same as in .