909
Views
38
CrossRef citations to date
0
Altmetric
Research Article

Cytokine and autoantibody patterns in acute liver failure

, , , , , & show all
Pages 157-164 | Received 22 Sep 2009, Accepted 20 Nov 2009, Published online: 29 Dec 2009

Figures & data

Table 1. Correlation between IL-17 and other analytes in each patient category.

Figure 1. Biochemical parameters of liver failure patients. (A) Time from onset to hospitalization and serum levels of (B) AST and ALT, (C) bilirubin, and (D) alkaline phosphatase were compared between patients with acute liver failure of different etiologies. Statistical significance between IDILI patients (n = 39) and other patient groups (APAP, n = 21; Hepatitis A and B, n = 5 each) was determined by the t-test with Welch’s correction; levels of significance are indicated in the figure.
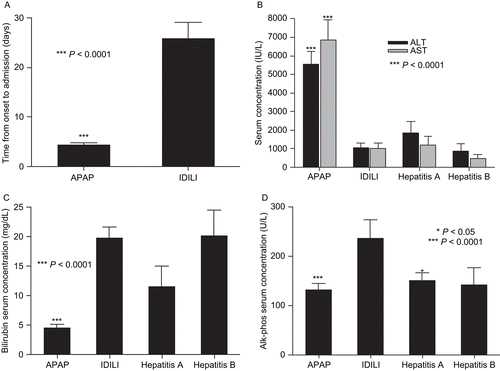
Figure 1.  Biochemical parameters of liver failure patients. (A) Time from onset to hospitalization and serum levels of (B) AST and ALT, (C) bilirubin, and (D) alkaline phosphatase were compared between patients with acute liver failure of different etiologies. Statistical significance between IDILI patients (n = 39) and other patient groups (APAP, n = 21; Hepatitis A and B, n = 5 each) was determined by the t-test with Welch’s correction; levels of significance are indicated in the figure.

Figure 2. TH17-related cytokine/chemokine comparisons between patient groups. Serum concentrations of TH17-related cytokines/chemokines (e.g., IL-17, IL-21, IL-6, and IL-1α) were measured by Luminex using a human multiplex kit. The statistical significance of any differences between the APAP (n = 21) and IDILI (n = 39) patients’ values were determined by the t-test with Welch’s correction; levels of significance are indicated in the figure. Data from patients in the Hepatitis A, B, and C virus groups are shown for comparison (n = 5, 5, and 10, respectively).
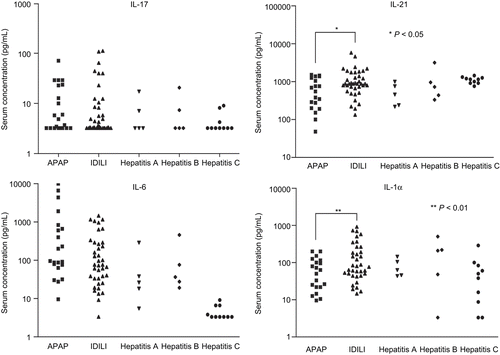
Figure 2.  TH17-related cytokine/chemokine comparisons between patient groups. Serum concentrations of TH17-related cytokines/chemokines (e.g., IL-17, IL-21, IL-6, and IL-1α) were measured by Luminex using a human multiplex kit. The statistical significance of any differences between the APAP (n = 21) and IDILI (n = 39) patients’ values were determined by the t-test with Welch’s correction; levels of significance are indicated in the figure. Data from patients in the Hepatitis A, B, and C virus groups are shown for comparison (n = 5, 5, and 10, respectively).
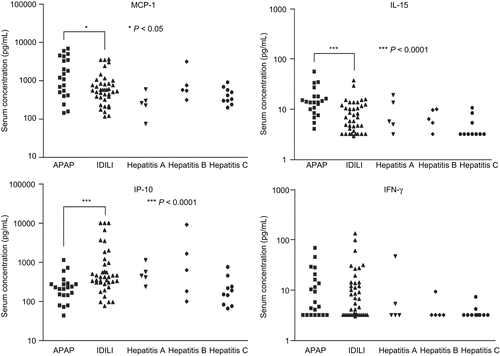
Figure 3. Innate cytokine/chemokine comparisons between patient groups. Serum concentrations of innate cytokines/chemokines (e.g., MCP-1, IL-15, IP-10, and IFNγ) were measured by Luminex using a human multiplex kit. The statistical significance of any differences between the APAP (n = 21) and IDILI (n = 39) patients’ values were determined by the t-test with Welch’s correction; levels of significance are indicated in the figure. Data from patients in the Hepatitis A, B, and C virus groups are shown for comparison (n = 5, 5, and 10, respectively).

Figure 3.  Innate cytokine/chemokine comparisons between patient groups. Serum concentrations of innate cytokines/chemokines (e.g., MCP-1, IL-15, IP-10, and IFNγ) were measured by Luminex using a human multiplex kit. The statistical significance of any differences between the APAP (n = 21) and IDILI (n = 39) patients’ values were determined by the t-test with Welch’s correction; levels of significance are indicated in the figure. Data from patients in the Hepatitis A, B, and C virus groups are shown for comparison (n = 5, 5, and 10, respectively).

Figure 4. Serum levels of BAFF. Serum concentrations of BAFF were measured by ELISA. The statistical significance of any difference between the APAP (n = 21) and IDILI (n = 39) patients’ values was determined by the t-test with Welch’s correction by the t-test with Welch’s correction; level of significance is indicated in the figure.
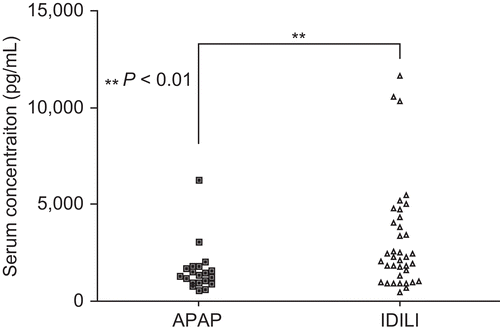
Figure 4.  Serum levels of BAFF. Serum concentrations of BAFF were measured by ELISA. The statistical significance of any difference between the APAP (n = 21) and IDILI (n = 39) patients’ values was determined by the t-test with Welch’s correction by the t-test with Welch’s correction; level of significance is indicated in the figure.

Figure 5. Serum levels of ANA. Serum levels of ANA were measured using an ELISA kit that detects 9 different anti-nuclear antibodies. Serum samples were diluted in 1:100 and the manufacturer indicates that values greater than 10 should be considered positive. The statistical significance of any difference between the APAP (n = 21) and IDILI (n = 39) patients’ values was determined by the t-test with Welch’s correction; level of significance is indicated in the figure. Data from patients in the Hepatitis A, B, and C virus groups are shown for comparison (n = 5, 5, and 10, respectively).
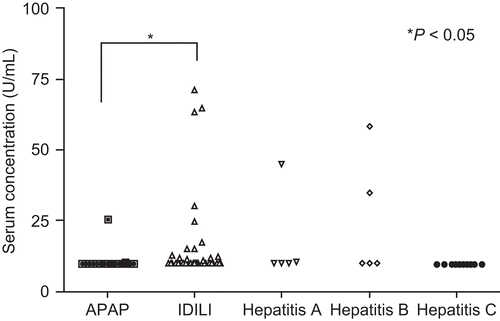
Figure 5.  Serum levels of ANA. Serum levels of ANA were measured using an ELISA kit that detects 9 different anti-nuclear antibodies. Serum samples were diluted in 1:100 and the manufacturer indicates that values greater than 10 should be considered positive. The statistical significance of any difference between the APAP (n = 21) and IDILI (n = 39) patients’ values was determined by the t-test with Welch’s correction; level of significance is indicated in the figure. Data from patients in the Hepatitis A, B, and C virus groups are shown for comparison (n = 5, 5, and 10, respectively).
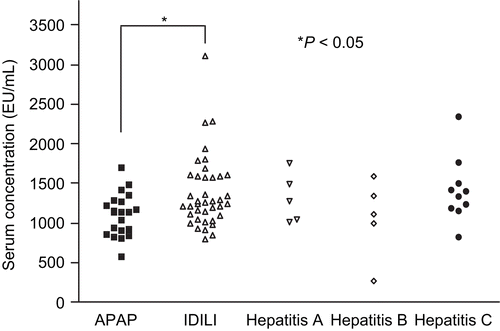
Figure 6. Serum levels of anti-MPO antibodies. Serum anti-MPO levels were determined (semi-quantitation) by an ELISA kit. Serum samples were diluted in 1:100. The statistical significance of any difference between the APAP (n = 21) and IDILI (n = 39) patients’ values was determined by the t-test with Welch’s correction; level of significance is indicated in the figure. Data from patients in the Hepatitis A, B, and C virus groups are shown for comparison (n = 5, 5, and 10, respectively).

Figure 6.  Serum levels of anti-MPO antibodies. Serum anti-MPO levels were determined (semi-quantitation) by an ELISA kit. Serum samples were diluted in 1:100. The statistical significance of any difference between the APAP (n = 21) and IDILI (n = 39) patients’ values was determined by the t-test with Welch’s correction; level of significance is indicated in the figure. Data from patients in the Hepatitis A, B, and C virus groups are shown for comparison (n = 5, 5, and 10, respectively).

Table 2. Levels of IL-17, IL-21, IL-6, IP-10 (Luminex assay), ANA, and anti-MPO (ELISA assay) in individual IDILI patients.

Supplemental material

Supplementary Material

Download PDF (1.9 MB)

Reprints and Corporate Permissions

Please note: Selecting permissions does not provide access to the full text of the article, please see our help page How do I view content?

To request a reprint or corporate permissions for this article, please click on the relevant link below:

Academic Permissions

Please note: Selecting permissions does not provide access to the full text of the article, please see our help page How do I view content?

Obtain permissions instantly via Rightslink by clicking on the button below:

If you are unable to obtain permissions via Rightslink, please complete and submit this Permissions form. For more information, please visit our Permissions help page.