Figures & data
Figure 1. Morphological changes in thymus and spleen. Frozen sections (5 μm) of (A) thymic and (B) splenic tissues from young mice that had been injected subcutaneously (SC, daily, for 60 days) with 0.4 mL PBS (control) or d-galactose [0.4 mL of solution (in PBS) prepared—based on weekly measures of animal body weight (BW)—to result in a dosage of 50 mg/kg body BW], as well as from aged (24-month-old) untreated C57BL/6J mice. Sections were stained with H&E (hematoxylin and eosin) and then examined under 100× and 200× magnifications for, respectively. the spleen and thymus samples. Images here are from a representative mouse from each regimen (5 mice/group). In the photos of the thymus sections, “M” and “C” indicate medulla and cortex, respectively; in the spleen section photos, “f “indicates a B-lymphocyte follicle.
![Figure 1. Morphological changes in thymus and spleen. Frozen sections (5 μm) of (A) thymic and (B) splenic tissues from young mice that had been injected subcutaneously (SC, daily, for 60 days) with 0.4 mL PBS (control) or d-galactose [0.4 mL of solution (in PBS) prepared—based on weekly measures of animal body weight (BW)—to result in a dosage of 50 mg/kg body BW], as well as from aged (24-month-old) untreated C57BL/6J mice. Sections were stained with H&E (hematoxylin and eosin) and then examined under 100× and 200× magnifications for, respectively. the spleen and thymus samples. Images here are from a representative mouse from each regimen (5 mice/group). In the photos of the thymus sections, “M” and “C” indicate medulla and cortex, respectively; in the spleen section photos, “f “indicates a B-lymphocyte follicle.](/cms/asset/adcd66c1-eb91-45d1-91c8-bc9a62ac2cbd/iimt_a_451513_f0001_b.gif)
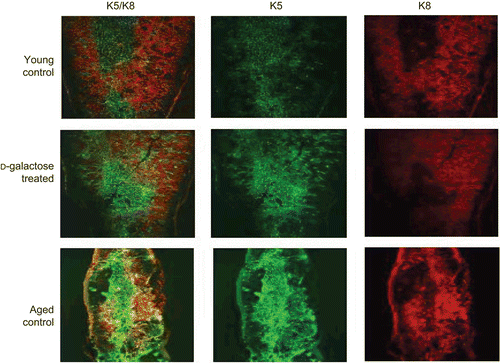
Figure 2. Architectural changes of TEC. Frozen sections (5 μm) of thymic tissues from young mice injected SC (daily, for 60 days) with PBS (control) or d-galactose (50 mg/kg BW; see legend for details), as well as from aged (24-month-old) untreated C57BL/6J mice were stained with rabbit anti-keratin-5 and biotin-conjugated anti-keratin-8 antibodies. Immunoreactivity was detected with AF488-conjugated goat anti-rabbit IgG and PE-conjugated streptavidin, respectively, and then observed using a confocal laser scanning microscope. Images are from representative mouse from each of the indicated regimens (5 mice/group).

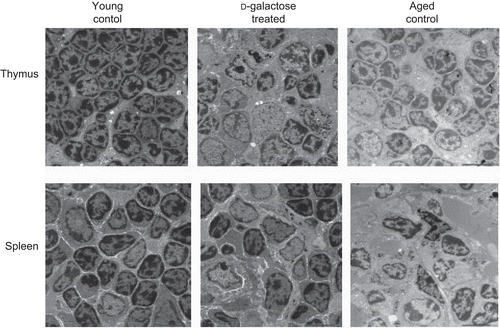
Figure 3. Ultrastructural analysis of thymus and spleen. Electron micrograph (1000×) of thymus (upper panel) and spleen (lower panel) from control C57BL/6J mice injected SC (daily, for 60 days) with PBS (n = 4) or d-galactose (50 mg/kg BW; see legend for details) (n = 4), and from aged (24-month-old) control mice (n = 3). 70-nm ultrathin sections of both thymus and spleen were stained with uranyl acetate and lead stain solution, observed with a TEM, and photographed at 1000×. The images here are from a representative mouse from each of the indicated regimens.

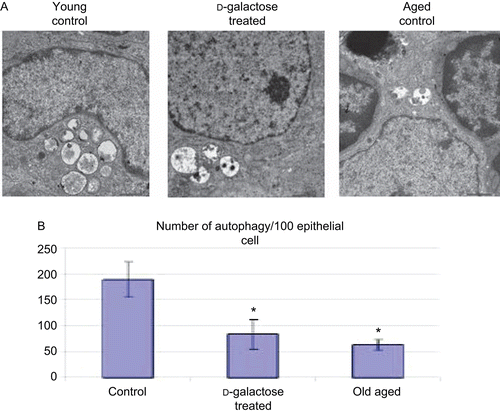
Figure 4. Distribution of autophagic vacuoles in TEC. (A) Electron micrograph (4000×) of thymus from C57BL/6J mice injected SC (daily, for 60 days) with PBS (control; n = 4) or d-galactose (50 mg/kg BW, n = 4; see legend for details), and from aged (24-month-old, n = 3) control mice. 70-nm ultrathin sections were stained with uranyl acetate and lead stain solution and examined using a TEM. An autophagic vacuole (arrow) in thymic epithelial cell is shown (at 4000×). The images here are from a representative mouse from each of the indicated regimens. (B) Total number of TEC in the thymic ultrastructure and autophagic vacuoles in TEC were counted; values shown are mean (± SD) number of autophagic vacuoles/100 TEC counted in samples from each indicated group of mice. *Value significantly different from that seen with the control young mice.

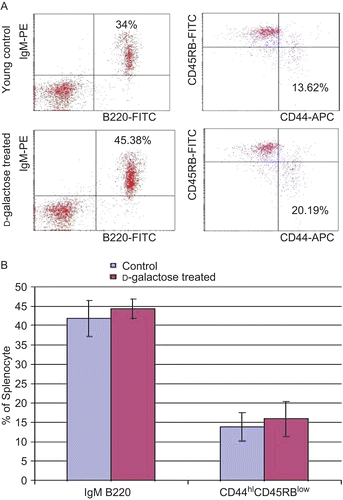
Figure 5. Flow cytometric analysis of splenocytes. (A) Cell suspensions were obtained from the spleens of young mice (C57BL/6J) injected SC (daily, for 60 days) with PBS (control) or d-galactose (50 mg/kg BW; see legend for details). Cells were then double-stained with FITC-anti-B220 and PE-anti-IgM. The cells were gated on lymphocytes via their forward (FSC) and side-scatter (SSC) properties. Cells were also triple-stained with APC-anti-CD4, FITC-anti-CD44, and PE-anti-CD45RB. The cells were first gated on lymphocytes, and then gated on CD4+ cells to observe memory phenotype CD4+ T-lymphocytes. (B) Percentages of both B220+IgM+ double-positive mature B-lymphocytes and CD44hiCD45RBlow CD4+ memory phenotype T-lymphocytes from young control (n = 4) and d-galactose-treated (n = 5) mice. Values shown are the mean (± SD) percentages of each cell type within the examined populations of splenocytes from mice in each indicated treatment regimen.
