Figures & data
Figure 1. (A) Early apoptosis with sodium tungstate and ConA. Isolated PBL were treated with sodium tungstate and ConA (2.5 μg/mL) for 24, 48, and 72 h. Early apoptosis was measured as Annexin V+ and PI− cells. Data represent the mean and standard error of three individuals. Statistical differences between groups were determined by specific post hoc contrasts. (B) Late apoptosis/necrosis with sodium tungstate and ConA. Isolated PBL were treated with sodium tungstate and ConA (2.5 μg/mL) for 24, 48, and 72 h. Late apoptosis/necrosis was measured as Annexin V+/− and PI+ cells. Data represent the mean and standard error of three individuals. Statistical differences between groups were determined by specific post hoc contrasts. At each timepoint, bars with identical letters indicate statistically significant differences were present between the groups.
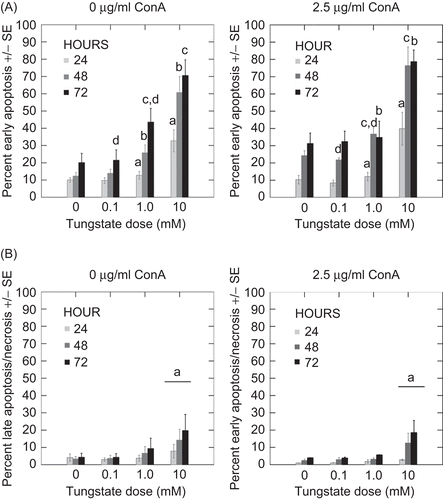
Figure 2. Cell cycle of PBL treated with sodium tungstate (1 mM) and ConA for 24, 48, and 96 h. Determinations of cell cycle were made with PBL stained with PI. Data represent the mean and standard error of three individuals. Bars with identical letters indicate statistically significant differences were present between the groups.
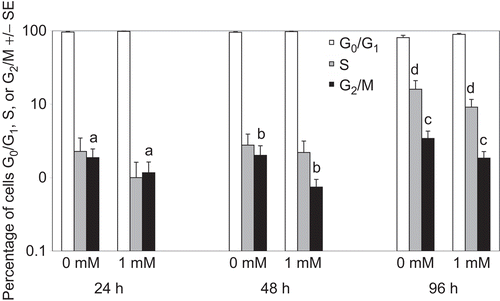
Figure 3. EdU staining in PBL treated with sodium tungstate for 72 h. Isolated PBL were treated with sodium tungstate (1 mM) and ConA (1.0 and 2.5 μg/mL) for 72 h. At 24 h before analysis, cells were incubated with EdU. (A) PBL that are EdU+ and in S phase of the cell cycle. (B) PBL that are EdU+ in G0/G1. Data represent the mean and standard error of values from three individuals. Bars with identical letters indicate statistically significant differences were present between the groups.
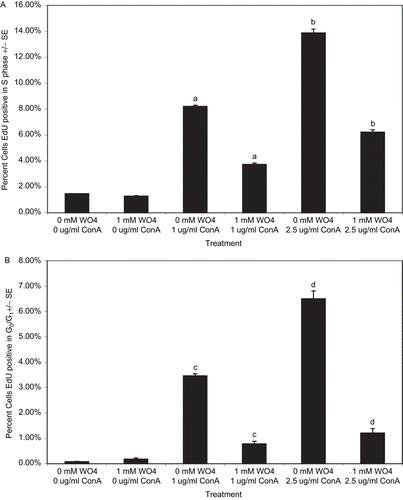
Figure 4. Cell cycle of THP-1 cells treated with sodium tungstate for 7 days. Cell cycle in THP-1 monocytes was determined by PI staining. Cells were kept in culture with appropriate quantities (0.01–10 mM) of tungstate for up to 7 days. Data represent the mean and standard error of three independent culture wells. The 10 mM tungstate treatment resulted in the loss of culture viability after 72 h; for clarity, the data from these cultures is not shown.
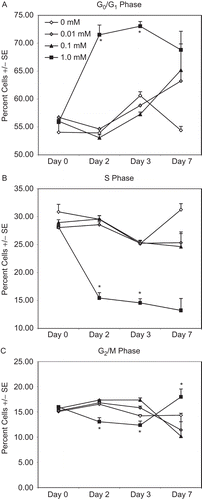
Figure 5. Silver stain of PBL soluble and insoluble fractions after treatment with tungstate. Soluble (non-DRM) and insoluble (DRM) fractions were prepared from PBL treated with tungstate for 72 h. Soluble and insoluble fractions were loaded at 12.5 and 6 µg protein per lane, respectively. Protein bands were visualized by silver staining.
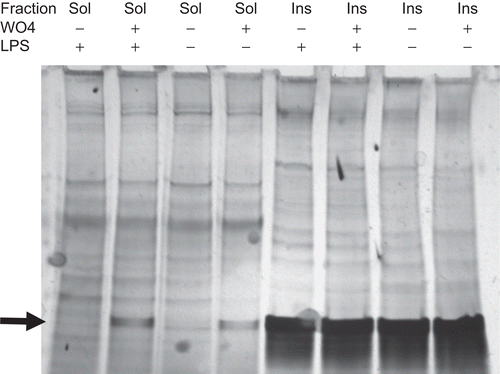
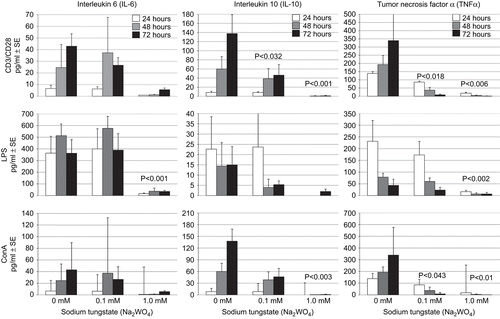
Figure 6. Cytokine production of IL-10, IL-6, and TNF-α by PBL treated with tungstate and CD3/CD28, ConA, or LPS for 24, 48, and 72 h. PBL were treated with LPS, ConA, or CD3/CD28 beads and culture supernatants subsequently collected for cytokine determinations. Cytokine production was measured from PBL of three individuals. Bars represent the mean and standard error. Note that y-axis scale bars vary depending on cytokine. P-values shown indicate level of significance of the difference between the value at a given dose of tungstate compared with the value of the control; generally, statistical analyses showed that dose was more important than culture time and so these P-values reflect the overall impact of the indicated dose across the three timeframes cited.