1,233
Views
11
CrossRef citations to date
0
Altmetric
Research Article

IL-16 effects on A549 lung epithelial cells: Dependence on CD9 as an IL-16 receptor?

, &
Pages 183-193 | Received 17 Nov 2009, Accepted 25 Jan 2010, Published online: 23 Mar 2010

Figures & data

Table 1. Primers used in mRNA analyses.

Figure 1. Expression of CD9 on the surface of A549 cells. (A) Unstained cells. (B) Non-specific isotype-treated cells. (C) PE-labeled anti-CD9 mAb-stained cells. Values in each window are the percentages of all cells analyzed that express CD9. Representative scattergrams (from duplicate analyses/regimen) are shown. A total of 3000 events were counted in each analysis.
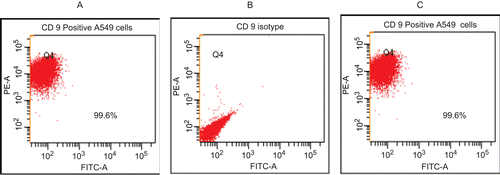
Figure 1.  Expression of CD9 on the surface of A549 cells. (A) Unstained cells. (B) Non-specific isotype-treated cells. (C) PE-labeled anti-CD9 mAb-stained cells. Values in each window are the percentages of all cells analyzed that express CD9. Representative scattergrams (from duplicate analyses/regimen) are shown. A total of 3000 events were counted in each analysis.

Figure 2. Chemotactic effects of rhIL-16 on A549 cells. Representative images (10× magnification) of migrated cells when 5 µg rhIL-16/ml was present in lower chamber: (A) A549 cells without pre-treatment; (B) pretreated with 10 µg anti-CD9 mAb/ml; or, (C) pre-treated 20 µg anti-CD9 mAb/ml. To facilitate demonstration of changes in cell numbers present in the fluorescence microscope view-field, the corresponding negative image is provided. (D) Quantification of migrated cells that had been pre-treated with varying levels (0, 5, 10, or 20 µg/ml; IL-16 only, mAb-5, mAb-10, and mAb-20 tags, respectively) of mAb rhIL-16 prior to placement in upper chamber; lower chamber held 5 µg rhIL-16/ml. (E) First five bars (left to right) Percentage: of migration among cells that had been pre-treated with varying concentrations of anti-CD9 mAb or with 20 µg NS IgG1/ml prior to placement in upper chamber; lower chamber held 5 µg rhIL-16/ml. Final three bars (left to right) Percentage: migration among cells that had been pre-treated with 20 µg mAb/ml or with 20 µg NS IgG1/ml prior to placement in upper chamber; lower chamber held 5 µg MCP-1/ml. X-axis designations (tags) in both sets of studies in (E) are as in (D). Data shown are the mean values from three samples per treatment. regimen. Value significantly different at *P < 0.05, **P < 0.01, or ***P < 0.001 compared to IL-16 only value and at ###P Value significantly different at *P < 0.05, **P < 0.01, or ***P < 0.001 compared to IL-16 only value ###P < 0.001 compared to MCP-1 only value.
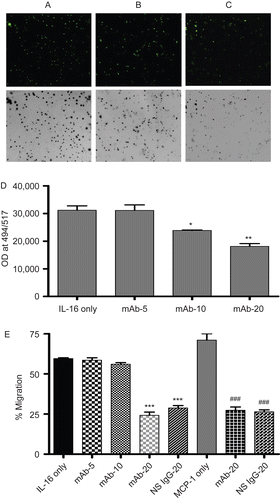
Figure 2.  Chemotactic effects of rhIL-16 on A549 cells. Representative images (10× magnification) of migrated cells when 5 µg rhIL-16/ml was present in lower chamber: (A) A549 cells without pre-treatment; (B) pretreated with 10 µg anti-CD9 mAb/ml; or, (C) pre-treated 20 µg anti-CD9 mAb/ml. To facilitate demonstration of changes in cell numbers present in the fluorescence microscope view-field, the corresponding negative image is provided. (D) Quantification of migrated cells that had been pre-treated with varying levels (0, 5, 10, or 20 µg/ml; IL-16 only, mAb-5, mAb-10, and mAb-20 tags, respectively) of mAb rhIL-16 prior to placement in upper chamber; lower chamber held 5 µg rhIL-16/ml. (E) First five bars (left to right) Percentage: of migration among cells that had been pre-treated with varying concentrations of anti-CD9 mAb or with 20 µg NS IgG1/ml prior to placement in upper chamber; lower chamber held 5 µg rhIL-16/ml. Final three bars (left to right) Percentage: migration among cells that had been pre-treated with 20 µg mAb/ml or with 20 µg NS IgG1/ml prior to placement in upper chamber; lower chamber held 5 µg MCP-1/ml. X-axis designations (tags) in both sets of studies in (E) are as in (D). Data shown are the mean values from three samples per treatment. regimen. Value significantly different at *P < 0.05, **P < 0.01, or ***P < 0.001 compared to IL-16 only value and at ###P Value significantly different at *P < 0.05, **P < 0.01, or ***P < 0.001 compared to IL-16 only value ###P < 0.001 compared to MCP-1 only value.

Figure 3. Functionality/growth of A549 cells under different treatment condition detected using an MTT assay. Effects of the treatments are expressed as the percentage of the average control value. (A) Functionality/growth of A549 cells after treatment with various concentrations (0.05, 0.50, or 5.00 µg/ml) of rIL-16 for 24 h. (B) Functionality/growth among cells that had undergone pre-treatment with 0, 0.4, or 20 µg mAb CD9/ml or with 20 µg non-specific IgG1/ml) (IL-16 only, mAb-0.4, mAb-20, and NS IgG-20 tags, respectively) prior to a 5.00 µg rhIL-16/ml treatment for 24 h. Data shown are the mean (± SD) values from three samples per treatment regimen. Value significantly different at *P < 0.05, **P < 0.01, or ***P < 0.001 compared to IL-16-only value and at **P < 0.01 or ***P < 0.001 when compared to untreated cells’ value.
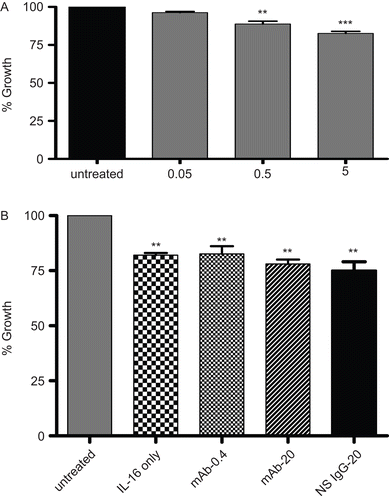
Figure 3.  Functionality/growth of A549 cells under different treatment condition detected using an MTT assay. Effects of the treatments are expressed as the percentage of the average control value. (A) Functionality/growth of A549 cells after treatment with various concentrations (0.05, 0.50, or 5.00 µg/ml) of rIL-16 for 24 h. (B) Functionality/growth among cells that had undergone pre-treatment with 0, 0.4, or 20 µg mAb CD9/ml or with 20 µg non-specific IgG1/ml) (IL-16 only, mAb-0.4, mAb-20, and NS IgG-20 tags, respectively) prior to a 5.00 µg rhIL-16/ml treatment for 24 h. Data shown are the mean (± SD) values from three samples per treatment regimen. Value significantly different at *P < 0.05, **P < 0.01, or ***P < 0.001 compared to IL-16-only value and at **P < 0.01 or ***P < 0.001 when compared to untreated cells’ value.

Figure 4. Cell proliferation potential of rhIL-16-treated A549 cells assessed by BrdU-labeling assay. Measures (expressed as the absorbance at 405 nm) made after treatment of cells with 5.00 µg rhIL-16/ml or vehicle (untreated control) for 24 h. Bars represent the mean optical density (OD) values (± SD) from two samples per treatment regimen. Value significantly different at *P < 0.05 when compared to untreated cells’ value.
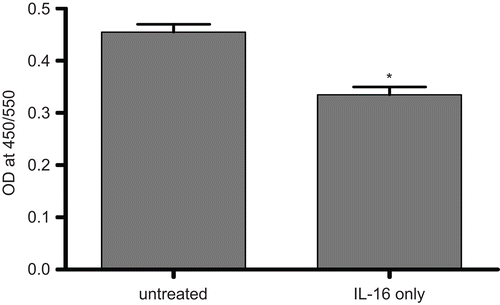
Figure 4.  Cell proliferation potential of rhIL-16-treated A549 cells assessed by BrdU-labeling assay. Measures (expressed as the absorbance at 405 nm) made after treatment of cells with 5.00 µg rhIL-16/ml or vehicle (untreated control) for 24 h. Bars represent the mean optical density (OD) values (± SD) from two samples per treatment regimen. Value significantly different at *P < 0.05 when compared to untreated cells’ value.

Figure 5. LDH release by rIL-16-treated A549 cells. (A) Percentage (%) increase in LDH release (relative to untreated control cells’ value; untreated cells’ value set at 0) after treatment with rIL-16 (0.05, 0.50, or 5.00 µg/ml) for 24 h. (B) Percentage (%) increase in LDH release (relative to untreated control cells’ value) among cells pre-treated with 0, 0.4, or 20 µg mAb CD9/ml or with 20 µg non-specific IgG1/ml) (IL-16 only, mAb-0.4, mAb-20, and NS IgG-20 tags, respectively) prior to a 5.00 µg rhIL-16/ml treatment for 24 h. Each result shown represents mean % increase in LDH release (± SD) of three independent experiments; each experiment was performed in triplicate.
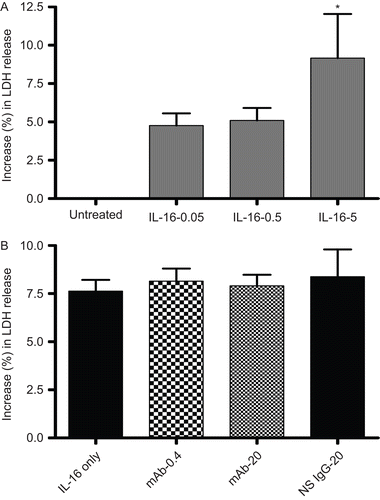
Figure 5.  LDH release by rIL-16-treated A549 cells. (A) Percentage (%) increase in LDH release (relative to untreated control cells’ value; untreated cells’ value set at 0) after treatment with rIL-16 (0.05, 0.50, or 5.00 µg/ml) for 24 h. (B) Percentage (%) increase in LDH release (relative to untreated control cells’ value) among cells pre-treated with 0, 0.4, or 20 µg mAb CD9/ml or with 20 µg non-specific IgG1/ml) (IL-16 only, mAb-0.4, mAb-20, and NS IgG-20 tags, respectively) prior to a 5.00 µg rhIL-16/ml treatment for 24 h. Each result shown represents mean % increase in LDH release (± SD) of three independent experiments; each experiment was performed in triplicate.

Figure 6. Capsase-3 levels in rIL-16-treated A549 cells. Caspase-3 level in A549 cells pretreated with 0, 0.4, or 20 µg mAb CD9/ml or with 20 µg non-specific IgG1/ml) (IL-16 only, mAb-0.4, mAb-20, and NS IgG-20 tags, respectively) prior to a 5.00 µg rhIL-16/ml treatment for 24 h. To assess apoptosis inducibility in the cell line, a dedicated set of cells was treated with 10 µM etoposide in place of the rhIL-16 (i.e., positive control). Each bar represents the mean optical density (OD) values (±SD) from two samples per treatment regimen. Value significantly different at **P < 0.01 or ***P < 0.001 when compared to untreated cells’ value.
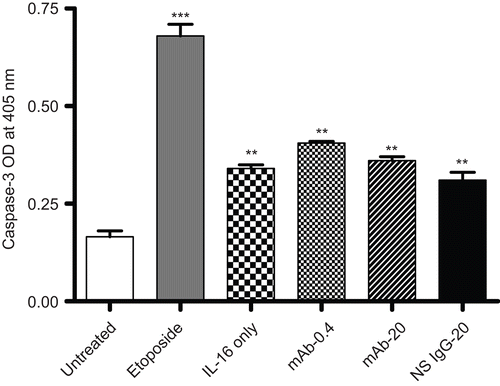
Figure 6.  Capsase-3 levels in rIL-16-treated A549 cells. Caspase-3 level in A549 cells pretreated with 0, 0.4, or 20 µg mAb CD9/ml or with 20 µg non-specific IgG1/ml) (IL-16 only, mAb-0.4, mAb-20, and NS IgG-20 tags, respectively) prior to a 5.00 µg rhIL-16/ml treatment for 24 h. To assess apoptosis inducibility in the cell line, a dedicated set of cells was treated with 10 µM etoposide in place of the rhIL-16 (i.e., positive control). Each bar represents the mean optical density (OD) values (±SD) from two samples per treatment regimen. Value significantly different at **P < 0.01 or ***P < 0.001 when compared to untreated cells’ value.

Figure 7. TUNEL analysis of A549 cells treated with rhIL-16 for 24 h. (A) DAPI staining in 5.0 µg rhIL-16/ml-treated cells. (B) TUNEL-positive nuclei in 5.0 µg rhIL-16/ml-treated cells. (C) Merged images; arrows (chevrons) indicate TUNEL+ nuclei. (D) Control samples stained with DAPI and TUNEL (showing DAPI+ nuclei only; no signals were captured in case of TUNEL staining in control samples - thus, image not shown). (E) Percentages (%) of TUNEL+ cells among all control or rhIL-16-treated (0.5 or 5.0 µg/ml) A549 cells. The bars represent the mean TUNEL-positive cell percentage (± SD) from two samples per treatment regimen. Value significantly different at *P < 0.05 when compared to untreated cells’ value.
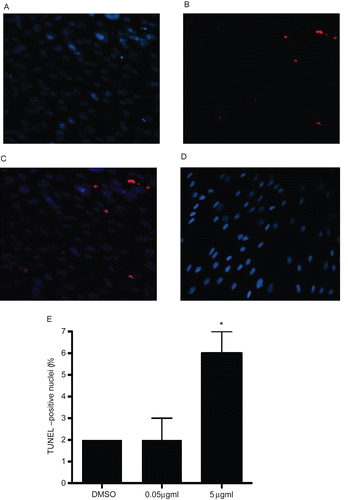
Figure 7.  TUNEL analysis of A549 cells treated with rhIL-16 for 24 h. (A) DAPI staining in 5.0 µg rhIL-16/ml-treated cells. (B) TUNEL-positive nuclei in 5.0 µg rhIL-16/ml-treated cells. (C) Merged images; arrows (chevrons) indicate TUNEL+ nuclei. (D) Control samples stained with DAPI and TUNEL (showing DAPI+ nuclei only; no signals were captured in case of TUNEL staining in control samples - thus, image not shown). (E) Percentages (%) of TUNEL+ cells among all control or rhIL-16-treated (0.5 or 5.0 µg/ml) A549 cells. The bars represent the mean TUNEL-positive cell percentage (± SD) from two samples per treatment regimen. Value significantly different at *P < 0.05 when compared to untreated cells’ value.

Figure 8. Expression levels of Bcl-2 family member proteins in rhIL-16-treated A549 cells. (A) Immunoblot shown is a representative blot from at least two generated per treatment regimen. (B–D) Bars reflect expression patterns of (B) Bcl-2, (C) Bad, and (D) Bax in control and in cells treated with the indicated doses of rhIL-16 for 24 h. Each bar represents the mean OD values (± SD)—reflective of specific protein’s expression—from two samples per treatment regimen.
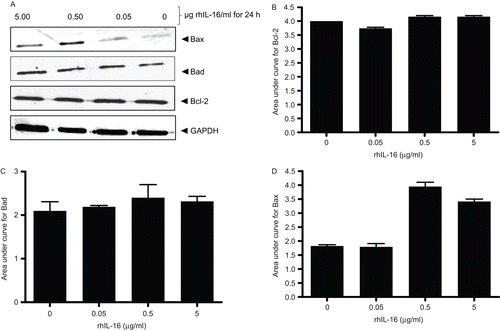
Figure 8.  Expression levels of Bcl-2 family member proteins in rhIL-16-treated A549 cells. (A) Immunoblot shown is a representative blot from at least two generated per treatment regimen. (B–D) Bars reflect expression patterns of (B) Bcl-2, (C) Bad, and (D) Bax in control and in cells treated with the indicated doses of rhIL-16 for 24 h. Each bar represents the mean OD values (± SD)—reflective of specific protein’s expression—from two samples per treatment regimen.

Figure 9. Comparison of Bcl-2a, Bcl-xl, and Bax mRNA expression levels in rhIL-16-treated as compared to those in untreated (control) A549 cells. Total RNA were extracted following a 24-h treatment with 5.0 µg rIL-16/ml or medium only, and mRNA were then amplified by RT-PCR using specific primers (see ). Results represent fold-change in each mRNA transcript relative to values associated with the untreated cells (set at a value of 1.0). All data were generated using the ΔCt method. Each bar represents the mean relative transcript levels (± SD) from two samples per treatment regimen. Value significantly different at *P < 0.05 when compared to untreated cells value.
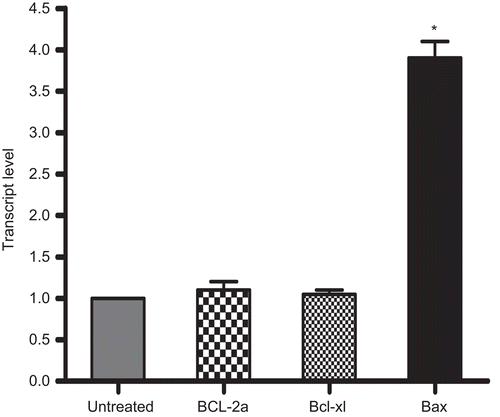
Figure 9.  Comparison of Bcl-2a, Bcl-xl, and Bax mRNA expression levels in rhIL-16-treated as compared to those in untreated (control) A549 cells. Total RNA were extracted following a 24-h treatment with 5.0 µg rIL-16/ml or medium only, and mRNA were then amplified by RT-PCR using specific primers (see Table 1). Results represent fold-change in each mRNA transcript relative to values associated with the untreated cells (set at a value of 1.0). All data were generated using the ΔCt method. Each bar represents the mean relative transcript levels (± SD) from two samples per treatment regimen. Value significantly different at *P < 0.05 when compared to untreated cells value.

Reprints and Corporate Permissions

Please note: Selecting permissions does not provide access to the full text of the article, please see our help page How do I view content?

To request a reprint or corporate permissions for this article, please click on the relevant link below:

Academic Permissions

Please note: Selecting permissions does not provide access to the full text of the article, please see our help page How do I view content?

Obtain permissions instantly via Rightslink by clicking on the button below:

If you are unable to obtain permissions via Rightslink, please complete and submit this Permissions form. For more information, please visit our Permissions help page.