1,693
Views
51
CrossRef citations to date
0
Altmetric
Research Articles

Lung exposure of titanium dioxide nanoparticles induces innate immune activation and long-lasting lymphocyte response in the Dark Agouti rat

, , &
Pages 111-121 | Received 15 Oct 2010, Accepted 06 Dec 2010, Published online: 10 Feb 2011

Figures & data

Figure 1. Dose-dependent differences in the number of cells in bronchoalveolar lavage fluid from rats 24 h after intratracheal instillation with nanosized TiO2. One-way ANOVA with Dunnett’s post-test; value is significantly (*P < 0.05 and **P < 0.01) different vs. phosphate-buffered saline (PBS) control. Data are presented as mean ± SEM (n = 6).
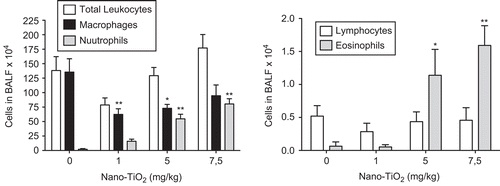
Figure 1.  Dose-dependent differences in the number of cells in bronchoalveolar lavage fluid from rats 24 h after intratracheal instillation with nanosized TiO2. One-way ANOVA with Dunnett’s post-test; value is significantly (*P < 0.05 and **P < 0.01) different vs. phosphate-buffered saline (PBS) control. Data are presented as mean ± SEM (n = 6).

Table 1. Proportion of natural killer (NK) cells expressing NKR-P1Abright.

Figure 2. The number of cells in bronchoalveolar lavage fluid from nano-TiO2 (5 mg/kg)-exposed rats 0 (n = 10), 1 (n = 20), 2 (n = 15), 8 (n = 11), 16 (n = 5), 30 (n = 6), and 90 (n = 6) days post-intratracheal instillation. One-way ANOVA with Dunnett’s post hoc test was employed, and values significantly changed vs. nonexposed control animals (timepoint 0) are indicated (*P < 0.05, **P < 0.01, ***P < 0.001). A Student’s t-test was performed to compare TiO2-exposed rats with that of rats exposed for phosphate-buffered saline (PBS) only at Days 1, 16, 30, and 90 ($$P < 0.01, $$$P < 0.001). Data are presented as mean ± SEM.
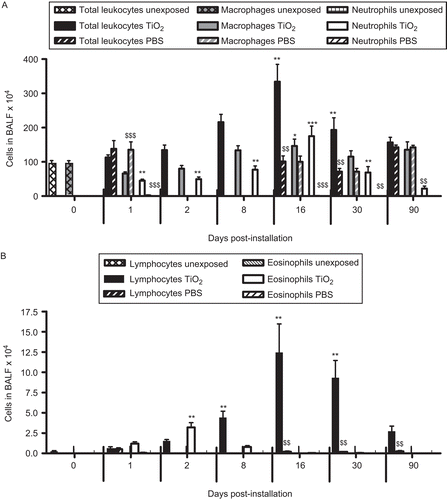
Figure 2.  The number of cells in bronchoalveolar lavage fluid from nano-TiO2 (5 mg/kg)-exposed rats 0 (n = 10), 1 (n = 20), 2 (n = 15), 8 (n = 11), 16 (n = 5), 30 (n = 6), and 90 (n = 6) days post-intratracheal instillation. One-way ANOVA with Dunnett’s post hoc test was employed, and values significantly changed vs. nonexposed control animals (timepoint 0) are indicated (*P < 0.05, **P < 0.01, ***P < 0.001). A Student’s t-test was performed to compare TiO2-exposed rats with that of rats exposed for phosphate-buffered saline (PBS) only at Days 1, 16, 30, and 90 ($$P < 0.01, $$$P < 0.001). Data are presented as mean ± SEM.

Figure 3. Numbers of NK T-cells (CD3+ NKR-P1A+), NK cells (CD3 NKR-P1A+), B-cells (CD3 CD45+), and dendritic cells (CD3 CD45RA OX-62+ OX-6+) in bronchoalveolar lavage fluid from nanosized TiO2 (5 mg/kg) exposed rats 0 (n = 5), 1 (n = 7), 2 (n = 7), 8 (n = 10), 16 (n = 5), 30 (n = 5), and 90 (n = 4) days after a single intratracheal instillation. Kruskal–Wallis test with Dunn’s post-test; value is significantly (*P < 0.05, **P < 0.01, ***P < 0.001) different vs. control.
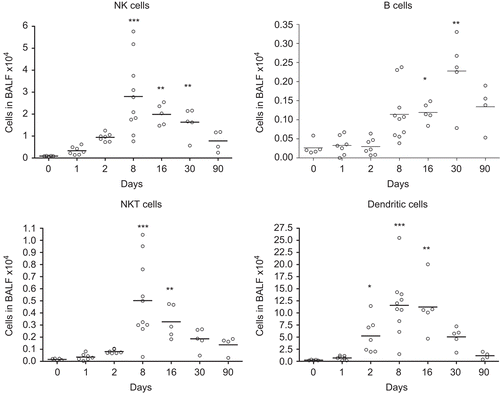
Figure 3.  Numbers of NK T-cells (CD3+ NKR-P1A+), NK cells (CD3− NKR-P1A+), B-cells (CD3− CD45+), and dendritic cells (CD3− CD45RA− OX-62+ OX-6+) in bronchoalveolar lavage fluid from nanosized TiO2 (5 mg/kg) exposed rats 0 (n = 5), 1 (n = 7), 2 (n = 7), 8 (n = 10), 16 (n = 5), 30 (n = 5), and 90 (n = 4) days after a single intratracheal instillation. Kruskal–Wallis test with Dunn’s post-test; value is significantly (*P < 0.05, **P < 0.01, ***P < 0.001) different vs. control.
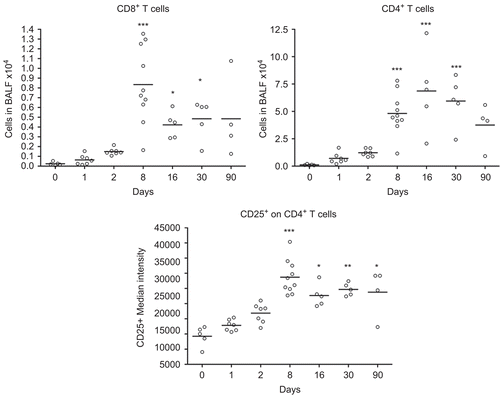
Figure 4. Numbers of cytotoxic T-cells (CD3+ CD8+) and CD4+ T-cells, and median intensity of CD25 receptor expression on CD4+ T-cells in bronchoalveolar lavage fluid from nanosized TiO2 (5 mg/kg) exposed rats 0 (n = 5), 1 (n = 7), 2 (n = 7), 8 (n = 10), 16 (n = 5), 30 (n = 5), and 90 (n = 4) days after a single intratracheal instillation. Kruskal–Wallis test with Dunn’s post-test; value is significantly (*P < 0.05, **P < 0.01, ***P < 0.001) different vs. control.
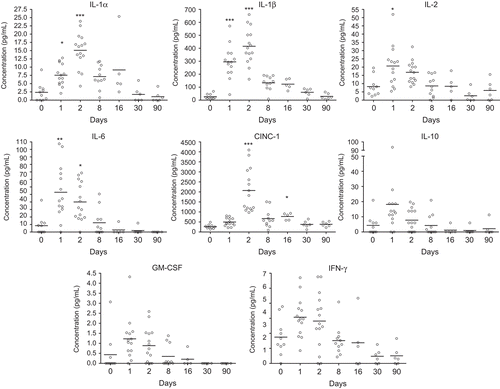
Figure 4.  Numbers of cytotoxic T-cells (CD3+ CD8+) and CD4+ T-cells, and median intensity of CD25 receptor expression on CD4+ T-cells in bronchoalveolar lavage fluid from nanosized TiO2 (5 mg/kg) exposed rats 0 (n = 5), 1 (n = 7), 2 (n = 7), 8 (n = 10), 16 (n = 5), 30 (n = 5), and 90 (n = 4) days after a single intratracheal instillation. Kruskal–Wallis test with Dunn’s post-test; value is significantly (*P < 0.05, **P < 0.01, ***P < 0.001) different vs. control.

Figure 5. Concentration of cytokines in bronchoalveolar lavage fluid from nanosized TiO2 (5 mg/kg)-exposed rats 0 (n = 10), 1 (n = 14), 2 (n = 15), 8 (n = 11), 16 (n = 5), 30 (n = 6), and 90 (n = 6) days after a single intratracheal instillation. Kruskal–Wallis test with Dunn’s post-test; value is significantly (*P < 0.05, **P < 0.01, ***P < 0.001) different vs. control.

Figure 5.  Concentration of cytokines in bronchoalveolar lavage fluid from nanosized TiO2 (5 mg/kg)-exposed rats 0 (n = 10), 1 (n = 14), 2 (n = 15), 8 (n = 11), 16 (n = 5), 30 (n = 6), and 90 (n = 6) days after a single intratracheal instillation. Kruskal–Wallis test with Dunn’s post-test; value is significantly (*P < 0.05, **P < 0.01, ***P < 0.001) different vs. control.

Figure 6. Concentration of cytokines in serum from nano-TiO2 (5 mg/kg) exposed rats 0 (n = 10), 1 (n = 13), 2 (n = 15), 8 (n = 11), 16 (n = 5), 30 (n = 6), and 90 (n = 5) days after a single intratracheal instillation. Kruskal–Wallis test with Dunn’s post-test; value is significantly (*P < 0.05, **P < 0.01) different vs. control.
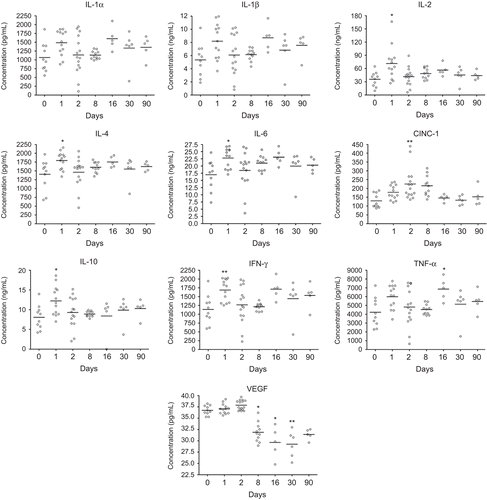
Figure 6.  Concentration of cytokines in serum from nano-TiO2 (5 mg/kg) exposed rats 0 (n = 10), 1 (n = 13), 2 (n = 15), 8 (n = 11), 16 (n = 5), 30 (n = 6), and 90 (n = 5) days after a single intratracheal instillation. Kruskal–Wallis test with Dunn’s post-test; value is significantly (*P < 0.05, **P < 0.01) different vs. control.

Figure 7. Lung sections from rat tissue showing particle uptake at Days 2 (A and B), 30 (C and D), and 90 (E and F) post-nano-TiO2 exposure. Particle aggregates (arrows) can be found in alveolar macrophages at Days 2 and 30, and mainly in the interstitium at Day 90. The tissues were stained with hematoxylin–eosin.
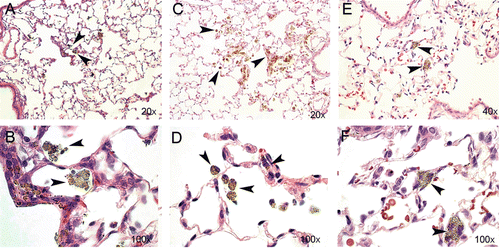
Figure 7.  Lung sections from rat tissue showing particle uptake at Days 2 (A and B), 30 (C and D), and 90 (E and F) post-nano-TiO2 exposure. Particle aggregates (arrows) can be found in alveolar macrophages at Days 2 and 30, and mainly in the interstitium at Day 90. The tissues were stained with hematoxylin–eosin.