1,556
Views
25
CrossRef citations to date
0
Altmetric
Research Articles

Sulforaphane inhibits de novo synthesis of IL-8 and MCP-1 in human epithelial cells generated by cigarette smoke extract

&
Pages 150-158 | Received 22 Dec 2010, Accepted 25 Jan 2011, Published online: 14 Mar 2011

Figures & data

Figure 1.  Cell viability in BEAS-2B cells after treatment with sulforaphane (SFN). BEAS-2B cells were treated with different concentrations of SFN for 24 h. Viability was then quantified using an MTT assay. Data presented are mean percent viability (±SEM, n = 5). *Value is significantly different compared with control cells (P < 0.05).
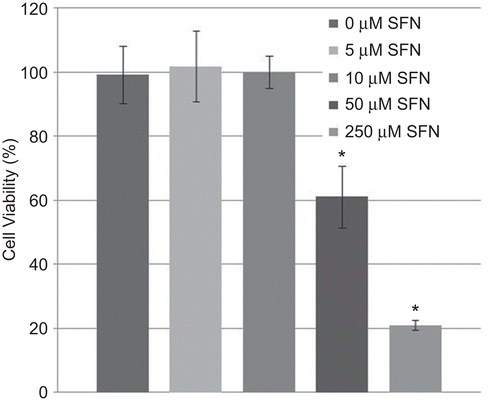
Figure 1.  Cell viability in BEAS-2B cells after treatment with sulforaphane (SFN). BEAS-2B cells were treated with different concentrations of SFN for 24 h. Viability was then quantified using an MTT assay. Data presented are mean percent viability (±SEM, n = 5). *Value is significantly different compared with control cells (P < 0.05).

Figure 2.  Messenger RNA levels of NQO1, GCLM, and HO-1 in BEAS-2B cells after 12 and 24 h treatment with DMSO (as a control) or 5 µM SFN. Fold change was calculated using the formula described in the Materials and methods. Data presented are mean fold-change (±SEM, n = 3). *Value is significantly different compared with control cells (P < 0.05).
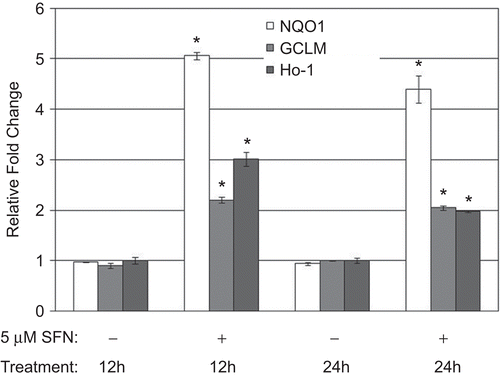
Figure 2.  Messenger RNA levels of NQO1, GCLM, and HO-1 in BEAS-2B cells after 12 and 24 h treatment with DMSO (as a control) or 5 µM SFN. Fold change was calculated using the formula described in the Materials and methods. Data presented are mean fold-change (±SEM, n = 3). *Value is significantly different compared with control cells (P < 0.05).

Figure 3.  Immunoblot analysis of NRF2 and NQO1 in BEAS-2B cells treated with DMSO (as a control) or 5 µM SFN for various lengths of time. (A) Immunoblots of the nuclear extracts from the treated cells were probed with an anti-human NRF2 antibody, stripped, and re-probed with an anti-human HDAC2 antibody. (B) Immunoblots of the cytosolic extracts were probed with an anti-human NQO1 antibody, stripped, and re-probed with an anti-human GAPDH antibody.
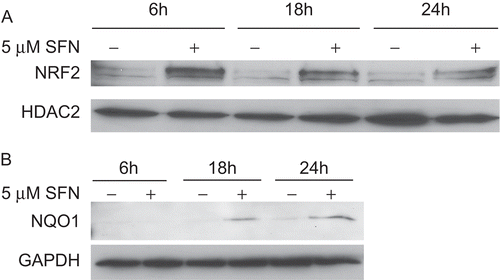
Figure 3.  Immunoblot analysis of NRF2 and NQO1 in BEAS-2B cells treated with DMSO (as a control) or 5 µM SFN for various lengths of time. (A) Immunoblots of the nuclear extracts from the treated cells were probed with an anti-human NRF2 antibody, stripped, and re-probed with an anti-human HDAC2 antibody. (B) Immunoblots of the cytosolic extracts were probed with an anti-human NQO1 antibody, stripped, and re-probed with an anti-human GAPDH antibody.

Figure 4.  Chemokine quantification in human BEAS-2B epithelial cells exposed to CSE. (A) MCP-1 and (B) IL-8 levels in the culture supernatants of cells treated with DMSO or 5 µM SFN for 6 h, then treated with DMSO or 200 µg CSE/mL as described in the Materials and methods. Data presented are mean fold-change (±SEM, n = 3). *Value is significantly different compared with control cells not exposed to CSE (P < 0.05); Value is significantly different compared with cells exposed to CSE alone (P < 0.05).

Figure 4.  Chemokine quantification in human BEAS-2B epithelial cells exposed to CSE. (A) MCP-1 and (B) IL-8 levels in the culture supernatants of cells treated with DMSO or 5 µM SFN for 6 h, then treated with DMSO or 200 µg CSE/mL as described in the Materials and methods. Data presented are mean fold-change (±SEM, n = 3). *Value is significantly different compared with control cells not exposed to CSE (P < 0.05); †Value is significantly different compared with cells exposed to CSE alone (P < 0.05).
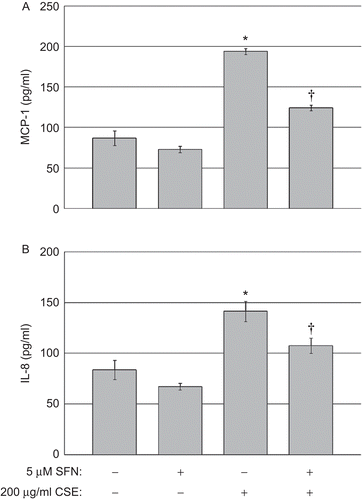
Figure 5.  BEAS-2B cell (A) MCP-1 and (B) IL-8 messenger RNA levels after CSE treatment. Filled and open circles denote cells exposed, respectively, to DMSO or 5 µM SFN for 6 h, then exposed to CSE as described in the Materials and methods. Data presented are mean fold-change; fold-change was calculated using formula described in the Materials and methods. *Value is significantly different from treatment-matched control cells not exposed to CSE (0 h) (P < 0.05); Value is significantly different between cells exposed to CSE treated with and without SFN (P < 0.05).
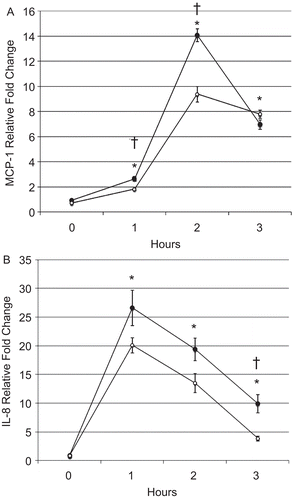
Figure 5.  BEAS-2B cell (A) MCP-1 and (B) IL-8 messenger RNA levels after CSE treatment. Filled and open circles denote cells exposed, respectively, to DMSO or 5 µM SFN for 6 h, then exposed to CSE as described in the Materials and methods. Data presented are mean fold-change; fold-change was calculated using formula described in the Materials and methods. *Value is significantly different from treatment-matched control cells not exposed to CSE (0 h) (P < 0.05); †Value is significantly different between cells exposed to CSE treated with and without SFN (P < 0.05).
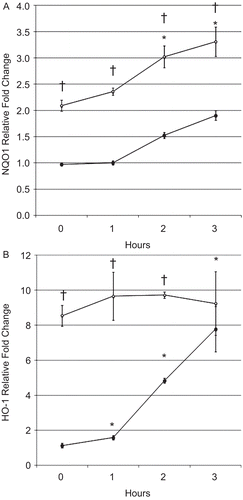
Figure 6.  BEAS-2B cell (A) NQO1 and (B) HO-1 messenger RNA levels after treatment with SFN and CSE. Fold change was calculated using the formula described in the section “Materials and methods.” Filled and open circles denote cells exposed, respectively, to DMSO or 5 µM SFN for 6 h, then exposed to CSE as described in the Materials and methods. Data presented are mean fold-change; fold-change was calculated using formula described in the Materials and methods. *Value is significantly different from treatment-matched control cells not exposed to CSE (0 h) (P < 0.05) Value is significantly different between cells exposed to CSE treated with and without SFN (P < 0.05).

Figure 6.  BEAS-2B cell (A) NQO1 and (B) HO-1 messenger RNA levels after treatment with SFN and CSE. Fold change was calculated using the formula described in the section “Materials and methods.” Filled and open circles denote cells exposed, respectively, to DMSO or 5 µM SFN for 6 h, then exposed to CSE as described in the Materials and methods. Data presented are mean fold-change; fold-change was calculated using formula described in the Materials and methods. *Value is significantly different from treatment-matched control cells not exposed to CSE (0 h) (P < 0.05) †Value is significantly different between cells exposed to CSE treated with and without SFN (P < 0.05).

Reprints and Corporate Permissions

Please note: Selecting permissions does not provide access to the full text of the article, please see our help page How do I view content?

To request a reprint or corporate permissions for this article, please click on the relevant link below:

Academic Permissions

Please note: Selecting permissions does not provide access to the full text of the article, please see our help page How do I view content?

Obtain permissions instantly via Rightslink by clicking on the button below:

If you are unable to obtain permissions via Rightslink, please complete and submit this Permissions form. For more information, please visit our Permissions help page.