697
Views
20
CrossRef citations to date
0
Altmetric
Research Articles

Alteration of fibroblast phenotype by asbestos-induced autoantibodies

, , &
Pages 159-169 | Received 10 Jan 2011, Accepted 08 Feb 2011, Published online: 04 Apr 2011

Figures & data

Figure 1.  Binding of serum antibodies to mouse fibroblasts indicates presence of anti-fibroblast antibodies in serum from asbestos-instilled mice. (A) Mouse primary skin fibroblasts were fixed with paraformaldehyde and stained using serum from (left) saline- or (right) tremolite-exposed mice as the primary antibody, followed by incubation with Alexa-488-conjugated anti-mouse IgG secondary Ab. Nuclei are stained with propidium iodide. Images (at 400×) are representative of multiple experiments. (B) A cell-based ELISA was performed using L929 mouse fibroblasts, to measure the binding of serum antibodies to the cells. As in A, binding of serum antibodies was compared between sera from saline- or tremolite-treated mice. N = 7, *P < 0.05 by unpaired 2-tailed t-test. (C) The cell-based ELISA was repeated using L929 cells, and including a positive control anti-fibroblast antibody (anti-Fb, anti-prolyl-4-hydroxy-lase), as well as serum from tremolite-exposed mice, either uncleared of IgG (trem unclr) or that had been cleared of IgG by Protein G precipitation (cleared). N = 4, *P < 0.05 compared to secondary antibody-only control.
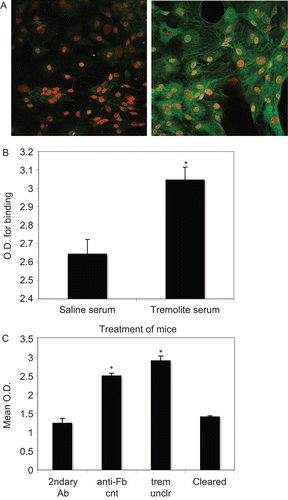
Figure 1.  Binding of serum antibodies to mouse fibroblasts indicates presence of anti-fibroblast antibodies in serum from asbestos-instilled mice. (A) Mouse primary skin fibroblasts were fixed with paraformaldehyde and stained using serum from (left) saline- or (right) tremolite-exposed mice as the primary antibody, followed by incubation with Alexa-488-conjugated anti-mouse IgG secondary Ab. Nuclei are stained with propidium iodide. Images (at 400×) are representative of multiple experiments. (B) A cell-based ELISA was performed using L929 mouse fibroblasts, to measure the binding of serum antibodies to the cells. As in A, binding of serum antibodies was compared between sera from saline- or tremolite-treated mice. N = 7, *P < 0.05 by unpaired 2-tailed t-test. (C) The cell-based ELISA was repeated using L929 cells, and including a positive control anti-fibroblast antibody (anti-Fb, anti-prolyl-4-hydroxy-lase), as well as serum from tremolite-exposed mice, either uncleared of IgG (trem unclr) or that had been cleared of IgG by Protein G precipitation (cleared). N = 4, *P < 0.05 compared to secondary antibody-only control.

Figure 2.  Expression of smooth muscle α-actin (SMA) is induced by treatment with sera from asbestos-exposed mice. (A) Mouse primary skin fibroblasts treated with sera from (left panel) saline- or (right panel) tremolite-exposed mice for 24 h were then fixed, permeabilized, and stained with anti-SMA. The secondary antibody was Alexa 488-conjugated and fluorescence was visualized at 400×. (B) The experiment was repeated using C57Bl/6 primary lung fibroblast cells, and fluorescence from the SMA expression was quantified by LSC as described in Materials and methods section. N = 3, **P < 0.01 comparing SMA expression induced by tremolite mouse serum to expression by untreated cells, using one-way ANOVA with Bonferroni’s Multiple Comparison Test.
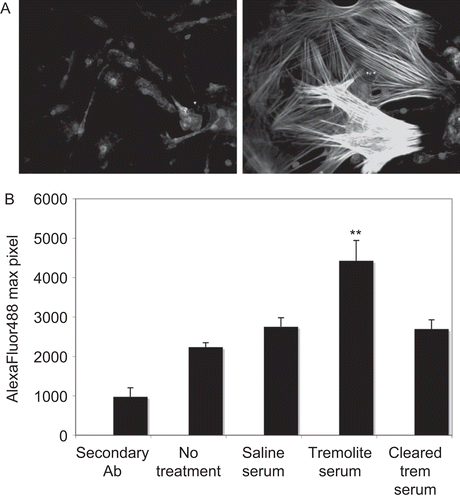
Figure 2.  Expression of smooth muscle α-actin (SMA) is induced by treatment with sera from asbestos-exposed mice. (A) Mouse primary skin fibroblasts treated with sera from (left panel) saline- or (right panel) tremolite-exposed mice for 24 h were then fixed, permeabilized, and stained with anti-SMA. The secondary antibody was Alexa 488-conjugated and fluorescence was visualized at 400×. (B) The experiment was repeated using C57Bl/6 primary lung fibroblast cells, and fluorescence from the SMA expression was quantified by LSC as described in Materials and methods section. N = 3, **P < 0.01 comparing SMA expression induced by tremolite mouse serum to expression by untreated cells, using one-way ANOVA with Bonferroni’s Multiple Comparison Test.

Figure 3.  Secretion of Type I collagen was induced by purified IgG from asbestos-exposed mice. (A) L929 cells were grown to confluence, treated with purified IgG from saline- or tremolite-exposed mice for 3 days, and then collagen production was detected using anti-collagen Type I antibody followed by Alexa 488-conjugated secondary antibody. Fluorescence was quantified by LSC. (B) Collagen production by L929 cells was also measured by Sircol assay, as described in Materials and methods section. Purified IgG = IgG from tremolite-exposed mice, Asb = tremolite asbestos alone at 40 µg/cm2, Asb and IgG = combined treatment with both tremolite and purified IgG from tremolite-instilled mice. N = 4 in each group, *P < 0.05 using one-way ANOVA with Bonferroni’s Multiple Comparison Test.
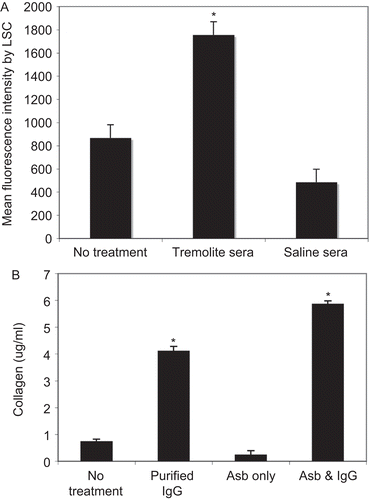
Figure 3.  Secretion of Type I collagen was induced by purified IgG from asbestos-exposed mice. (A) L929 cells were grown to confluence, treated with purified IgG from saline- or tremolite-exposed mice for 3 days, and then collagen production was detected using anti-collagen Type I antibody followed by Alexa 488-conjugated secondary antibody. Fluorescence was quantified by LSC. (B) Collagen production by L929 cells was also measured by Sircol assay, as described in Materials and methods section. Purified IgG = IgG from tremolite-exposed mice, Asb = tremolite asbestos alone at 40 µg/cm2, Asb and IgG = combined treatment with both tremolite and purified IgG from tremolite-instilled mice. N = 4 in each group, *P < 0.05 using one-way ANOVA with Bonferroni’s Multiple Comparison Test.

Figure 4.  ELISA for TGFβ in mouse serum and fibroblast culture supernatants. (A) Sera from saline- or asbestos-exposed mice were assayed for total TGFβ1 using an ELISA kit. N = 8 mice in each group. (B) Total TGFβ1 was also measured in supernatant samples from cultures of primary mouse lung fibroblasts exposed to serum from saline- and asbestos-exposed mice or to recombinant TGFβ at 4 ng/ml. N = 3, *P < 0.05 compared to No Treatment group.
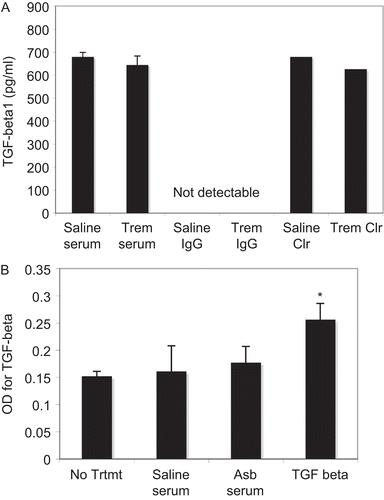
Figure 4.  ELISA for TGFβ in mouse serum and fibroblast culture supernatants. (A) Sera from saline- or asbestos-exposed mice were assayed for total TGFβ1 using an ELISA kit. N = 8 mice in each group. (B) Total TGFβ1 was also measured in supernatant samples from cultures of primary mouse lung fibroblasts exposed to serum from saline- and asbestos-exposed mice or to recombinant TGFβ at 4 ng/ml. N = 3, *P < 0.05 compared to No Treatment group.

Figure 5.  ELISA for antibodies to DNA topoisomerase I and PDGF-Rα. (A) The presence of anti-Topo I antibodies (Scl-70) were detected at a significantly higher level in the sera of asbestos-instilled mice by Scl-70 ELISA. N = 5 mice, *P < 0.05 by unpaired t-test. (B) ELISA was used to detect antibodies to PDGF-Rα. Scatter graph shows the OD values for individual mice in each group, with the mean for that groups indicated by a solid line. A hypothetical cut-off for positive/negative (dotted line) was calculated as two standard deviations above the mean for the saline group. *P < 0.05, N = 24 mice (combined mice from tremolite and 6-mix exposures).
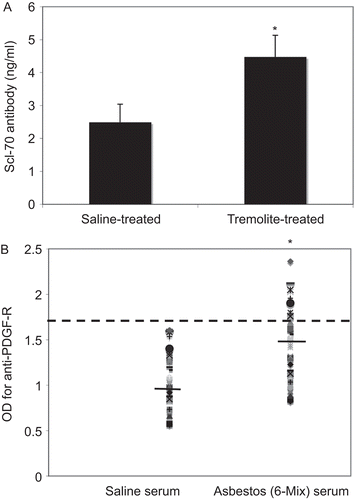
Figure 5.  ELISA for antibodies to DNA topoisomerase I and PDGF-Rα. (A) The presence of anti-Topo I antibodies (Scl-70) were detected at a significantly higher level in the sera of asbestos-instilled mice by Scl-70 ELISA. N = 5 mice, *P < 0.05 by unpaired t-test. (B) ELISA was used to detect antibodies to PDGF-Rα. Scatter graph shows the OD values for individual mice in each group, with the mean for that groups indicated by a solid line. A hypothetical cut-off for positive/negative (dotted line) was calculated as two standard deviations above the mean for the saline group. *P < 0.05, N = 24 mice (combined mice from tremolite and 6-mix exposures).

Figure 6.  STAT-1 translocates to the nucleus of treated L929 fibroblasts following treatment with asbestos-treated mouse serum. STAT-1 translocation was measured by LSC as described in the Materials and methods section. L929 cells were treated for 2 h with serum or cleared serum (1:50) from asbestos-treated mice, then fixed and stained for STAT-1. Max Pixel fluorescence intensity was determined in nuclear and peripheral contours, and data are expressed as the ratio of nuclear/peripheral staining intensity. N = 3 wells per treatment, *P < 0.05.
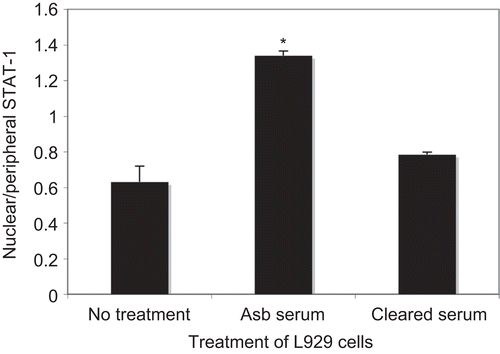
Figure 6.  STAT-1 translocates to the nucleus of treated L929 fibroblasts following treatment with asbestos-treated mouse serum. STAT-1 translocation was measured by LSC as described in the Materials and methods section. L929 cells were treated for 2 h with serum or cleared serum (1:50) from asbestos-treated mice, then fixed and stained for STAT-1. Max Pixel fluorescence intensity was determined in nuclear and peripheral contours, and data are expressed as the ratio of nuclear/peripheral staining intensity. N = 3 wells per treatment, *P < 0.05.

Reprints and Corporate Permissions

Please note: Selecting permissions does not provide access to the full text of the article, please see our help page How do I view content?

To request a reprint or corporate permissions for this article, please click on the relevant link below:

Academic Permissions

Please note: Selecting permissions does not provide access to the full text of the article, please see our help page How do I view content?

Obtain permissions instantly via Rightslink by clicking on the button below:

If you are unable to obtain permissions via Rightslink, please complete and submit this Permissions form. For more information, please visit our Permissions help page.