Figures & data
Table 1. Characteristics of NHP, immunization conditions, and TDAR assay readout units*.
Table 2A. Positive response rate by antigen: Primary response only.
Table 2B. Positive response rate by antigen: Secondary response only.
Table 3. Impact of risk factors on the rate of positive primary response, stratified by antigen, antibody and duration. Primary response only.
Table 4. Response rates: primary vs. secondary challenge.
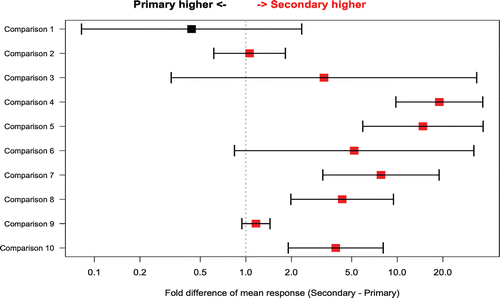
Figure 1. Fold difference in mean peak response between primary and secondary challenges (X axis) for selected comparisons from individual studies (Y axis). Bars around the point estimate display the 95% confidence interval. Point estimates and 95% confidence intervals were calculated by a linear mixed model on the loge scale and then back-transformed to the original scale. Red color denotes higher mean for secondary response and black higher mean for primary response. Comparison 1 = IgM, SRBC; comparison 2 = IgM, KLH; comparisons 3–5 = IgG, TT; comparison 6 = IgG, SRBC; comparisons 7–10 = IgG, KLH.

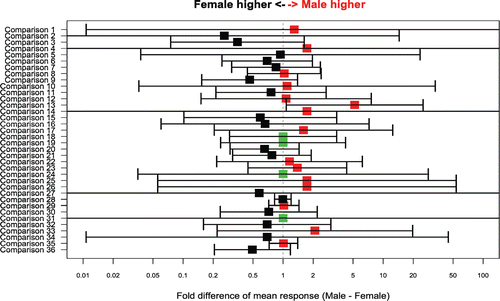
Figure 2. Difference in mean peak response between male and female NHPs (X axis) for selected comparisons from individual studies (Y axis). Bars around the point estimate display the 95% confidence interval for the estimate. Point estimates and 95% confidence intervals were calculated by a linear mixed model on the loge scale and then back-transformed to the original scale. Range of the X axis was limited to 0.01–100. The 95% confidence intervals for some of the smaller studies exceed this range. Red color denotes higher mean for males, black higher mean for females and green equivalent mean for males and females. Comparison 1 = secondary, IgM, KLH; comparisons 2 and 3 = secondary, IgG, TT; comparison 4 = secondary, IgG, SRBC; comparisons 5–11 = secondary, IgG, KLH; comparison 12 = primary, IgM, TT; comparison 13 and 14 = primary, IgM, SRBC; comparisons 15–20 = primary, IgM, KLH; comparisons 21–23 = primary, IgG, TT; comparisons 24–27 = primary, IgG, SRBC; comparisons 28–36 = primary, IgG, KLH.

Table 5. Effect of adjuvant on mean log peak response: KLH vs. KLH with IFA.
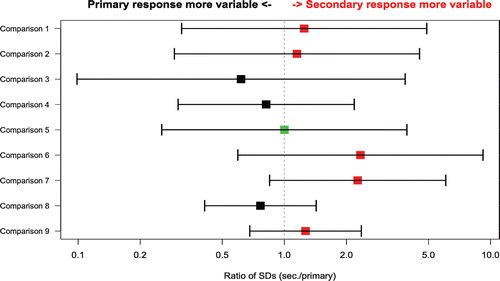
Figure 3. Ratio of the between-animal SD at peak between the primary and secondary response (X axis) for comparisons from selected individual studies (Y axis). The SDs from primary and secondary responses have been calculated on the loge scale. The bars represent the 95% confidence intervals around the estimates of the SD (secondary/primary) ratios, based on the F statistic. Vertical line at ratio = 1 denotes situation where inter-animal standard deviations for primary and secondary responses are identical. Red color denotes higher SD for secondary response, black higher SD for primary response and green equivalent SDs. Comparison 1 = IgM, KLH; comparisons 2–4 = IgG, TT; comparison 5 = IgG, SRBC; comparisons 6–9 = IgG, KLH.

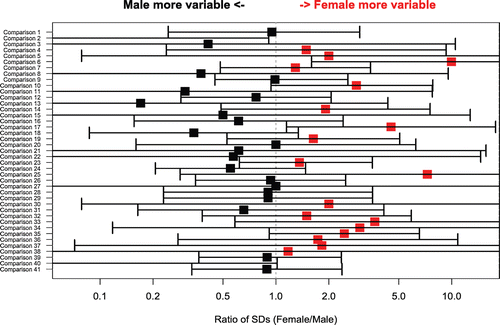
Figure 4. Ratio of the between-animal SD at peak between male and female NHPs (X axis) for comparisons from selected individual studies (Y axis). Ratios of the two SDs (male/female) were derived from the SDs calculated on the loge scale. Bars represent the 95% confidence intervals around the estimates of the SD ratio, based on the F statistic. Vertical line at ratio = 1 denotes situation where inter-animal standard deviations for the two genders responses are identical. Red color denotes higher mean for males, black higher mean for females and green equivalent for males and females. Comparisons 1 and 2 = secondary, IgM, KLH; comparisons 3 and 4 = secondary, IgG, TT; comparison 5 = secondary, IgG, SRBC; comparisons 6–12 = secondary, IgG, KLH; comparisons 13 = primary, IgM, TT; comparisons 14 and 15 = primary, IgM, SRBC; comparisons 16–21 = primary, IgM, KLH; comparisons 22–26 = primary, IgG, TT; comparisons 27–30 = primary, IgG, SRBC; comparisons 31–41 = primary, IgG, KLH.

Table 6. Between-animal standard deviation of loge response on peak response day by type of challenge, units of measurement, primary (1°)/secondary (2°) challenge, single/multiple challenge, and origin.
Table 7. Comparisons of variability at peak response: Primary and secondary responses included.
Table 8. Detectable fold differences* between two treatment groups. Assumptions: two-sided, independent samples t-test on loge data, one sample response value per animal, 80% power and p < 0.05 for statistical significance.
