778
Views
14
CrossRef citations to date
0
Altmetric
Research Article

Dynamics of lymphocyte subsets in children living in an area polluted by polychlorinated biphenyls

, , , &
Pages 333-345 | Received 08 Apr 2011, Accepted 16 Aug 2011, Published online: 20 Oct 2011

Figures & data

Table 1  Characteristics of study cohort consisting of 362 mother-infant pairs in two districts, Michalovce (n = 301) and Svidnik/Stropkov (n = 61).

Table 2  The maternal and birth characteristics of the study group.

Table 3  Total main lymphocyte subpopulations in cord, 6- and 16-months blood samples from Michalovce and Svidnik/Stropkov districts.

Table 4  CD marker correlation between samples of blood from children in the total study cohort.

Figure 1  Dynamics of the lymphocyte subsets in children in the Svidnik/Stropkov and Michalovce regions. The immunophenotyping was performed by multi-color analysis of blood samples collected form children at birth (cord blood), and again at 6- and 16-months-of-age. Populations of CD3+, CD3+CD4+, and CD3+CD8+ T-lymphocytes, CD19+ B-lymphocytes, HLADR+CD19+ activated B-lymphocytes, and CD3CD(56 + 16)+ NK cells in each sample were analyzed. Flow cytometric analysis was performed on a Cytomics FC 500 (Beckman Coulter). Statistical analysis was performed using an SPSS System. p-Values reflect comparisons made to cord blood levels. Data shown are as mean of percentage (± SEM).
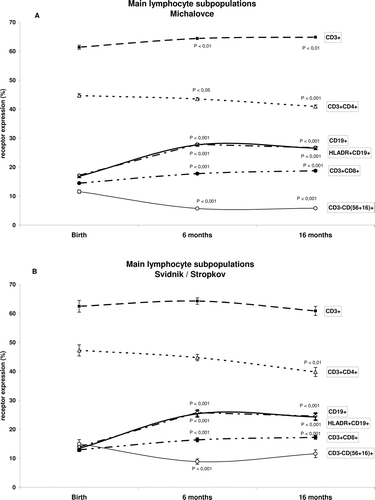
Figure 1  Dynamics of the lymphocyte subsets in children in the Svidnik/Stropkov and Michalovce regions. The immunophenotyping was performed by multi-color analysis of blood samples collected form children at birth (cord blood), and again at 6- and 16-months-of-age. Populations of CD3+, CD3+CD4+, and CD3+CD8+ T-lymphocytes, CD19+ B-lymphocytes, HLADR+CD19+ activated B-lymphocytes, and CD3−CD(56 + 16)+ NK cells in each sample were analyzed. Flow cytometric analysis was performed on a Cytomics FC 500 (Beckman Coulter). Statistical analysis was performed using an SPSS System. p-Values reflect comparisons made to cord blood levels. Data shown are as mean of percentage (± SEM).

Table 5  Coefficients and standard errors in models predicting immunophenotyping markers in samples of blood from children from Michalovce and Svidnik/Stropkov.

Reprints and Corporate Permissions

Please note: Selecting permissions does not provide access to the full text of the article, please see our help page How do I view content?

To request a reprint or corporate permissions for this article, please click on the relevant link below:

Academic Permissions

Please note: Selecting permissions does not provide access to the full text of the article, please see our help page How do I view content?

Obtain permissions instantly via Rightslink by clicking on the button below:

If you are unable to obtain permissions via Rightslink, please complete and submit this Permissions form. For more information, please visit our Permissions help page.