2,868
Views
20
CrossRef citations to date
0
Altmetric
Research Article

Evaluation of primary and secondary responses to a T-cell-dependent antigen, keyhole limpet hemocyanin, in rats

, , , , , , , & show all
Pages 40-48 | Received 09 Jan 2012, Accepted 30 Apr 2012, Published online: 07 Sep 2012

Figures & data

Figure 1.  Study designs of TDAR assays. Cyclophosphamide (CPA) was dosed orally to female rats for 14 consecutive days (1, 3, and 6 mg/kg). (A) Primary and secondary KLH-TDAR assay: Animals were immunized twice by IV injection of keyhole limpet hemocyanin (KLH, 300 μg/rat) on Days 5 and 9 during the 14-day CPA treatment. ELISA was used to determine serum anti-KLH IgM and anti-KLH IgG levels on Days 1, 9, and 15. (B) Traditional SRBC-PFC or SRBC-TDAR assay: Animals were immunized with IV injection of SRBC (2 × 10⁸ cells/body) on Day 11 during 14-day CPA treatment. Serum anti-SRBC IgM levels or anti-SRBC IgM producing cell counts were determined on Day 15 by ELISA or PFC assay, respectively.
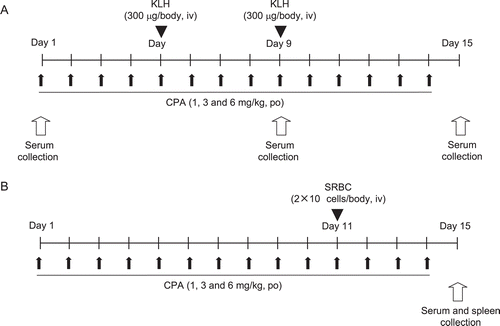
Figure 1.  Study designs of TDAR assays. Cyclophosphamide (CPA) was dosed orally to female rats for 14 consecutive days (1, 3, and 6 mg/kg). (A) Primary and secondary KLH-TDAR assay: Animals were immunized twice by IV injection of keyhole limpet hemocyanin (KLH, 300 μg/rat) on Days 5 and 9 during the 14-day CPA treatment. ELISA was used to determine serum anti-KLH IgM and anti-KLH IgG levels on Days 1, 9, and 15. (B) Traditional SRBC-PFC or SRBC-TDAR assay: Animals were immunized with IV injection of SRBC (2 × 10⁸ cells/body) on Day 11 during 14-day CPA treatment. Serum anti-SRBC IgM levels or anti-SRBC IgM producing cell counts were determined on Day 15 by ELISA or PFC assay, respectively.

Figure 2.  Primary and secondary antibody response to KLH in rats. Female rats were immunized twice with IV injection of KLH (300 μg/rat) on Days 5 and 9 during the course of the study. Left panel: Serum anti-KLH IgM levels, Right panel: Serum anti-KLH IgG levels, (A) and (E): SD rats; (B) and (F): Wistar rats; (C) and (G): Fischer rats; (D) and (H): Lewis rats. Values shown represent mean of eight control animals in each strain.
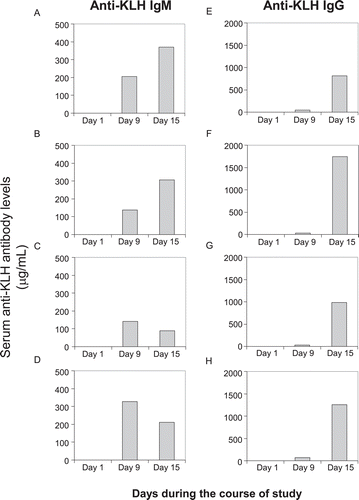
Figure 2.  Primary and secondary antibody response to KLH in rats. Female rats were immunized twice with IV injection of KLH (300 μg/rat) on Days 5 and 9 during the course of the study. Left panel: Serum anti-KLH IgM levels, Right panel: Serum anti-KLH IgG levels, (A) and (E): SD rats; (B) and (F): Wistar rats; (C) and (G): Fischer rats; (D) and (H): Lewis rats. Values shown represent mean of eight control animals in each strain.

Figure 3.  Inter-individual variation of anti-KLH antibody responses in rats. Female rats were immunized twice with IV injection of KLH (300 μg/rat) on Days 5 and 9 during the course of the study. (A) Serum anti-KLH IgM levels on Day 9. (B) Serum anti-KLH IgG levels on Day 9. (C) Serum anti-KLH IgM levels on Day 15. (D) Serum anti-KLH IgG levels on Day 15. Each circle and bar represent the individual value and mean of eight control animals in each strain. Each value in parentheses means the coefficient of variance.
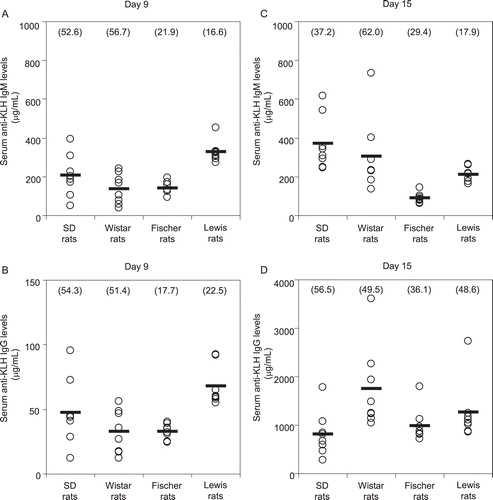
Figure 3.  Inter-individual variation of anti-KLH antibody responses in rats. Female rats were immunized twice with IV injection of KLH (300 μg/rat) on Days 5 and 9 during the course of the study. (A) Serum anti-KLH IgM levels on Day 9. (B) Serum anti-KLH IgG levels on Day 9. (C) Serum anti-KLH IgM levels on Day 15. (D) Serum anti-KLH IgG levels on Day 15. Each circle and bar represent the individual value and mean of eight control animals in each strain. Each value in parentheses means the coefficient of variance.

Figure 4.  Effect of CPA treatment on anti-KLH antibody responses in rats. CPA (1, 3, and 6 mg/kg) was dosed orally to female rats for 14 consecutive days. Animals were immunized twice with IV injection of KLH (300 μg/rat) on Days 5 and 9 during the CPA treatment. (A) Serum anti-KLH IgM levels on Day 9. (B) Serum anti-KLH IgG levels on Day 9. (C) Serum anti-KLH IgM levels on Day 15. (D) Serum anti-KLH IgG levels on Day 15. Each column and bar represents the mean (± SD) of eight animals. # p < 0.05, ## p < 0.01: Significantly different from respective control group in each strain (Dunnett test), * p < 0.05: Significantly different from respective control group in each strain (Dunnett rank test).
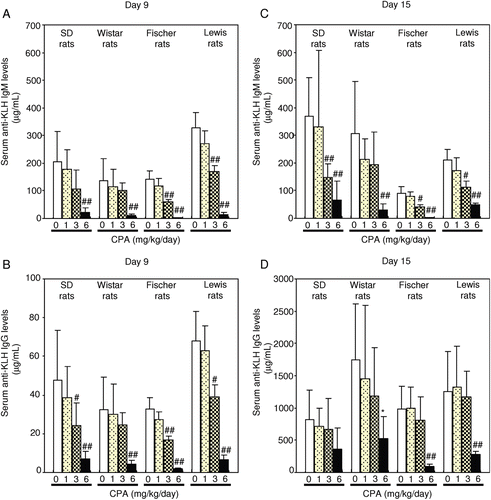
Figure 4.  Effect of CPA treatment on anti-KLH antibody responses in rats. CPA (1, 3, and 6 mg/kg) was dosed orally to female rats for 14 consecutive days. Animals were immunized twice with IV injection of KLH (300 μg/rat) on Days 5 and 9 during the CPA treatment. (A) Serum anti-KLH IgM levels on Day 9. (B) Serum anti-KLH IgG levels on Day 9. (C) Serum anti-KLH IgM levels on Day 15. (D) Serum anti-KLH IgG levels on Day 15. Each column and bar represents the mean (± SD) of eight animals. # p < 0.05, ## p < 0.01: Significantly different from respective control group in each strain (Dunnett test), * p < 0.05: Significantly different from respective control group in each strain (Dunnett rank test).
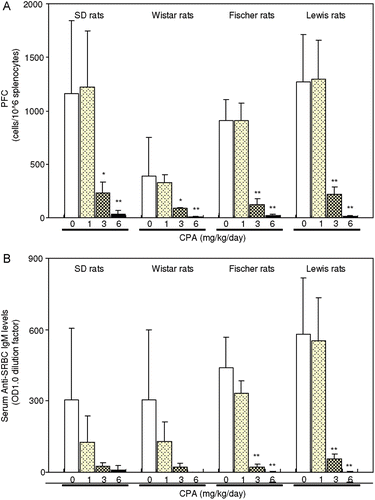
Figure 5.  Effect of CPA treatment on plaque-forming cells (PFC) assay and anti-SRBC IgM response by SRBC immunization in rats. CPA (1, 3, and 6 mg/kg) was dosed orally to female rats for 14 consecutive days. Animals were immunized with single intravenous injection of SRBC (2 × 10⁸ cells/rat) on Day 11 during the CPA treatment. (A) PFC on Day 15. (B) Serum anti-SRBC IgM levels on Day 15. Each column and bar represents the mean (± SD) of four-to-eight animals. ** p < 0.01, * p < 0.05: Significantly different from respective control group in each strain (Dunnett rank test).

Figure 5.  Effect of CPA treatment on plaque-forming cells (PFC) assay and anti-SRBC IgM response by SRBC immunization in rats. CPA (1, 3, and 6 mg/kg) was dosed orally to female rats for 14 consecutive days. Animals were immunized with single intravenous injection of SRBC (2 × 10⁸ cells/rat) on Day 11 during the CPA treatment. (A) PFC on Day 15. (B) Serum anti-SRBC IgM levels on Day 15. Each column and bar represents the mean (± SD) of four-to-eight animals. ** p < 0.01, * p < 0.05: Significantly different from respective control group in each strain (Dunnett rank test).

Reprints and Corporate Permissions

Please note: Selecting permissions does not provide access to the full text of the article, please see our help page How do I view content?

To request a reprint or corporate permissions for this article, please click on the relevant link below:

Academic Permissions

Please note: Selecting permissions does not provide access to the full text of the article, please see our help page How do I view content?

Obtain permissions instantly via Rightslink by clicking on the button below:

If you are unable to obtain permissions via Rightslink, please complete and submit this Permissions form. For more information, please visit our Permissions help page.