Figures & data
Figure 1. (a) Percentage increase in histamine release from BMMC following 30-min treatment with E2 (open bars) (n = 6) or BPA (solid bars) (n = 6). (b) CysLT release following 30-min treatment with BPA (n = 4). Bars represent mean ± SEM. *p < 0.05 and **p ≤ 0.001 compared to untreated cells.
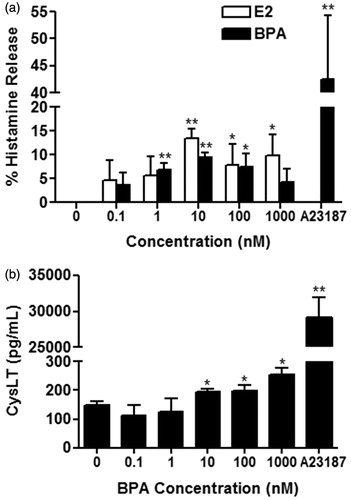
Figure 2. (a) Percentage increase in histamine release from BMMC pre-treated with ICI for 1 h before treatment with 10 nM E2 (open bars) (n = 3) or 10 nM BPA (solid bars) (n = 3) for 30 min. (b) CysLT release from BMMC pre-treated with (shaded bar) or without (solid bar) 1 μM ICI before treatment with 10 nM BPA (n = 4). Bars represent mean ± SEM. *p < 0.05 compared to no ICI treatment. †p < 0.05 compared to control.
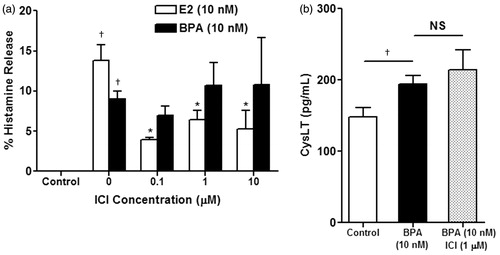
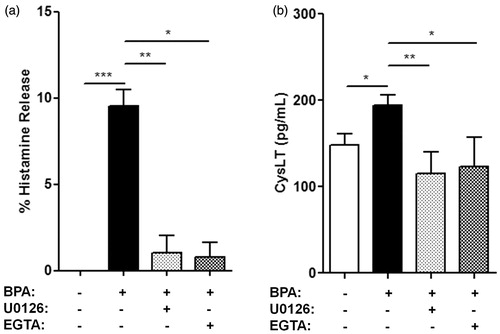
Figure 3. Percentage increase in (a) histamine release and (b) CysLT release from BMMC pre-treated with 10 μM U0126 (shaded bar) or 3 mM EGTA (checkered bar) for 1 h before treatment with 10 nM BPA for 30 min. Bars represent mean ± SEM. n = 3 for all experiments. *p < 0.05, **p < 0.005, and ***p < 0.001.