Figures & data
Table 1. Chemicals and dose settings.
Figure 1. Absolute thymus weights. Mice were treated with nothing (intact naive), vehicle, methoxychlor (MXC), parathion (PARA), piperonyl butoxide (PBO), or combinations of the agents (two at a time). Absolute thymus weights are expressed as mean ± SD (mg; n = 8 per group). **p < 0.01 (Dunnett’s multiple comparison test) vs vehicle control group; ΦΦ p < 0.01 (Student’s t-test) vs single test substance groups.
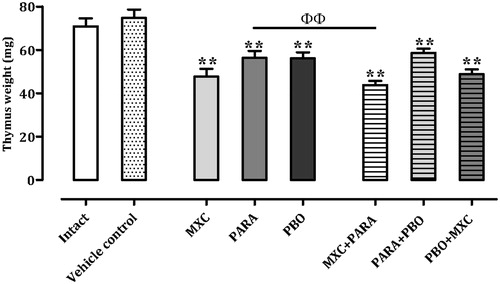
Figure 2. Serum and splenic IgM responses. Mice were treated as described in the legend. (a) Serum and (b) spleen IgM responses are shown. IgM responses are expressed as mean ± SD (titre; n = 8 per group). IgM responses in the spleen are expressed as mean ± SD (n = 8 per group). *p < 0.05 and **p < 0.01 (Dunnett’s multiple comparison test) vs vehicle control group; Φp < 0.05 and ΦΦp < 0.01 (Student’s t-test) vs single test substance groups.
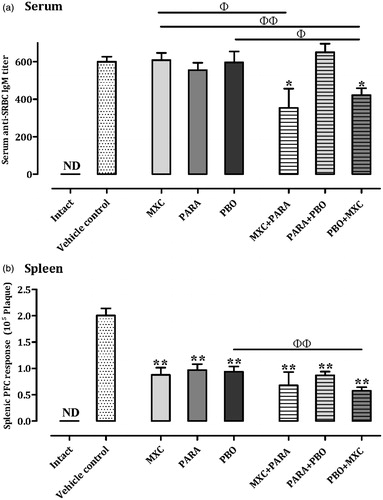
Figure 3. T-cell sub-type counts in spleens. Mice were treated as described in the legend. (a) Total, (b) helper, and (c) cytotoxic T-cell counts are shown. Results for intact, vehicle, and individual agent-treated mice are included in each chart. Cell counts are expressed as mean ± SD (n = 8 per group). *p < 0.05 and **p < 0.01 (Dunnett’s multiple comparison test) vs vehicle control group; Φp < 0.05 and ΦΦp < 0.01 (Student’s t-test) vs single test substance groups.
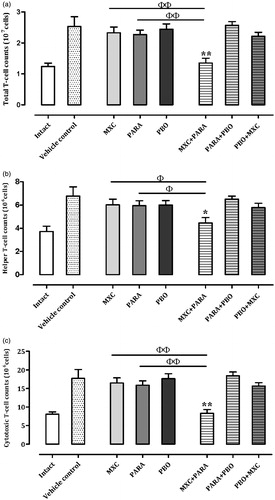
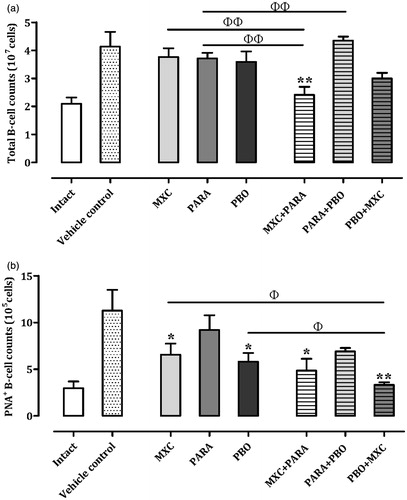
Figure 4. Total B-cell and germinal center B-cell counts in spleens. Mice were treated as described in the legend. (a) Total B-cell and (b) germinal center B-cell counts are shown. Results for intact, vehicle, and individual agent-treated mice are included in each chart. Cell counts are expressed as mean ± SD (n = 8 per group). *p < 0.05 and **p < 0.01 (Dunnett’s multiple comparison test) vs vehicle control group; Φp < 0.05 and ΦΦp < 0.01 (Student’s t-test) vs single test substance groups.