
Figures & data
Table 1. Food consumption by mice.
Figure 1. GLDH activities, body weights, and INH covalent binding in INH-treated Balb/c mice. (a) GLDH in male mice treated at 0.10 or 0.15% INH [w/w] in food for 5 weeks. (b) GLDH in female mice treated at 0.10 or 0.15% of INH [w/w] in food for 3 weeks or treated with 0.2% of INH + 0.05% pyridoxine•HCl (Pyr) [w/w] in food for 2 weeks. (c, d) Body weights of treated mice. (e, f) Covalent binding of INH in livers of male and female mice. Values represent mean (±SE) of four mice/group. Analyzed for statistical significance by a Mann-Whitney U test; *p < 0.05.
![Figure 1. GLDH activities, body weights, and INH covalent binding in INH-treated Balb/c mice. (a) GLDH in male mice treated at 0.10 or 0.15% INH [w/w] in food for 5 weeks. (b) GLDH in female mice treated at 0.10 or 0.15% of INH [w/w] in food for 3 weeks or treated with 0.2% of INH + 0.05% pyridoxine•HCl (Pyr) [w/w] in food for 2 weeks. (c, d) Body weights of treated mice. (e, f) Covalent binding of INH in livers of male and female mice. Values represent mean (±SE) of four mice/group. Analyzed for statistical significance by a Mann-Whitney U test; *p < 0.05.](/cms/asset/fea7a25f-ea24-48b4-8622-d700688c907f/iimt_a_860644_f0001_b.jpg)
Figure 2. Comparison of INH covalent binding in livers of different mice. (A) Male Cbl-b−/− mice treated with INH (0.2% or 0.2% + 0.05% pyridoxine•HCl [w/w] in food, n = 3). (B) Female (n = 4) and male (n = 3) Cbl-b−/− mice treated with 0.2% INH [w/w] in food. (C) Female C57BL/6 and Cbl-b−/− mice treated with 0.2% INH [w/w] in food (n = 4). (D) Female Cbl-b−/− control (n = 2), Cbl-b−/− (n = 4), or C3H mice (n = 3) treated with 0.2% INH [w/w] in food.
![Figure 2. Comparison of INH covalent binding in livers of different mice. (A) Male Cbl-b−/− mice treated with INH (0.2% or 0.2% + 0.05% pyridoxine•HCl [w/w] in food, n = 3). (B) Female (n = 4) and male (n = 3) Cbl-b−/− mice treated with 0.2% INH [w/w] in food. (C) Female C57BL/6 and Cbl-b−/− mice treated with 0.2% INH [w/w] in food (n = 4). (D) Female Cbl-b−/− control (n = 2), Cbl-b−/− (n = 4), or C3H mice (n = 3) treated with 0.2% INH [w/w] in food.](/cms/asset/41680d35-b21e-4562-903d-039a9d79aaf4/iimt_a_860644_f0002_b.jpg)
Figure 3. GLDH activities and body weights in INH-treated Cbl-b−/− mice. (A) GLDH in male mice treated with 0.2% INH [w/w] in food or 0.2% INH + 0.05% pyridoxine•HCl (INH + Pyr) [w/w] in food for 5 weeks. (B) GLDH in female mice treated with INH at 0.2% [w/w] in food for 5 weeks. (C, D) Body weights of male and female INH-treated mice. Values represent mean (±SE) from four mice/group. Analyzed for statistical significance by two-way ANOVA; *p < 0.05, **p < 0.01, ***p < 0.001.
![Figure 3. GLDH activities and body weights in INH-treated Cbl-b−/− mice. (A) GLDH in male mice treated with 0.2% INH [w/w] in food or 0.2% INH + 0.05% pyridoxine•HCl (INH + Pyr) [w/w] in food for 5 weeks. (B) GLDH in female mice treated with INH at 0.2% [w/w] in food for 5 weeks. (C, D) Body weights of male and female INH-treated mice. Values represent mean (±SE) from four mice/group. Analyzed for statistical significance by two-way ANOVA; *p < 0.05, **p < 0.01, ***p < 0.001.](/cms/asset/69cfd049-38cc-4531-b6e7-b7e74dad858a/iimt_a_860644_f0003_b.jpg)
Figure 4. H&E and immunohistochemical staining for anti-CD45R, F4/80, and PCNA in livers of Cbl-b−/− mice treated with INH (0.2% w/w in food) for 5 weeks. Control = untreated mice (n = 4); INH = mice treated with INH that did not develop abnormal liver histology (n = 3); INH steatosis = one mouse treated with INH that developed significant abnormal liver histology (n = 1). Red arrow = lymphocyte infiltration, yellow arrow = microvesicular steatosis, green arrow = macrovesicular steatosis, blue arrow = focal necrosis, orange arrow = cholestasis. 40× magnification for H&E; 20× magnification for CD45R, F4/80, and PCNA.
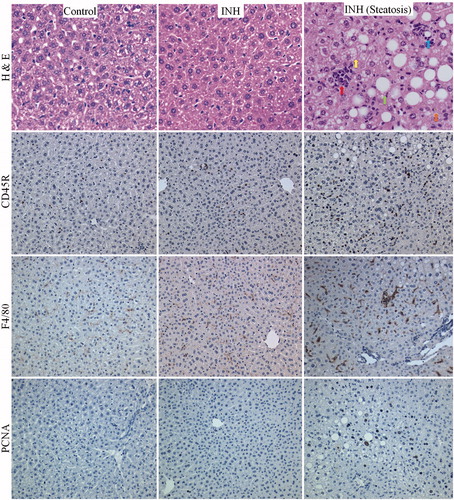
Figure 5. Serum concentrations of IL-1α and IL-12 (p70) in Cbl-b−/− control or mice treated with INH for 5 weeks. Values represent mean (±SE) from four mice/group. INH was given at 0.2% INH [w/w] in food. Analyzed for statistical significance by a Mann-Whitney U test; *p < 0.05.
![Figure 5. Serum concentrations of IL-1α and IL-12 (p70) in Cbl-b−/− control or mice treated with INH for 5 weeks. Values represent mean (±SE) from four mice/group. INH was given at 0.2% INH [w/w] in food. Analyzed for statistical significance by a Mann-Whitney U test; *p < 0.05.](/cms/asset/1e8fff1f-0140-4e55-a5fa-5f4012ef56a9/iimt_a_860644_f0005_b.jpg)
Figure 6. GLDH activity in female PD−/− and Rag−/− mice treated with INH. (A) INH was given at 0.2% [w/w] in food until Week 2 wherein the dose was decreased to 0.1% [w/w] in food for 1 week (until Week 3) because of weight loss. Mice were then put back on 0.2% INH [w/w] from Week 3–5. (B) Female C57BL/6 control or Rag−/− mice were treated with INH at 0.2% [w/w] for up to 12 weeks. Values represent mean (±SE). Analyzed for statistical significance by two-way ANOVA. A p value <0.05 was considered significant (*p < 0.05; **p < 0.01; ***p < 0.001).
![Figure 6. GLDH activity in female PD−/− and Rag−/− mice treated with INH. (A) INH was given at 0.2% [w/w] in food until Week 2 wherein the dose was decreased to 0.1% [w/w] in food for 1 week (until Week 3) because of weight loss. Mice were then put back on 0.2% INH [w/w] from Week 3–5. (B) Female C57BL/6 control or Rag−/− mice were treated with INH at 0.2% [w/w] for up to 12 weeks. Values represent mean (±SE). Analyzed for statistical significance by two-way ANOVA. A p value <0.05 was considered significant (*p < 0.05; **p < 0.01; ***p < 0.001).](/cms/asset/234cb001-8a95-4551-b1bc-c1bdf04d84e2/iimt_a_860644_f0006_b.jpg)