Figures & data
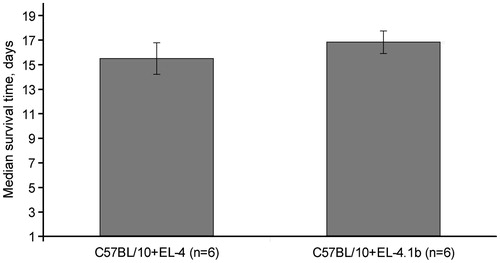
Figure 1. Proliferation in response to allogeneic stimulators. MLR responses of splenocytes from transgenic 1D1bFM and wild-type B10.D2(R101) mice to syngeneic B10.D2(R101), syngeneic 1D1bFM, allogeneic C57BL/10 (B10), and third-party FVB stimulators, treated with mitomycin C. Transgenic mice were at least 8-times back-crossed to B10.D2(R101) mice. Data shown are average of three replicates (± SEM). * p < 0.05 vs corresponding control. Similar data were obtained in three independent experiments.
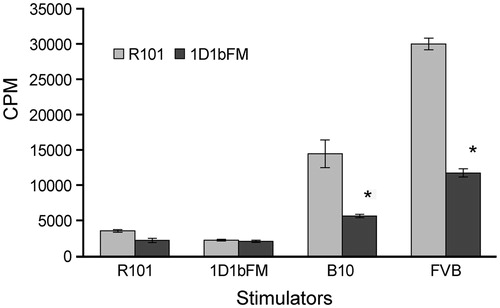
Figure 2. Flow cytometric analysis of splenocytes from wild-type B10.D2(R101) and 1D1bFM transgenic mice on genetic background B10.D2(R101) 12 d after immunization with EL4 thymoma cells. Ex vivo isolated splenocytes of intact (left panel) and immunized mice (right panel) were stained by antibodies and analyzed: (A, C) CD4, CD8 expression on surface of CD3+ splenocytes. (B, D) Vβ6 expression on CD3+CD8+ splenocytes. Data from one representative staining are shown. Similar results were obtained in three independent experiments.
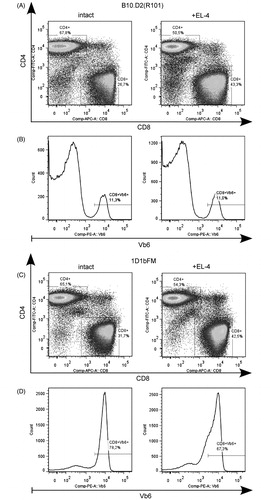
Figure 3. Flow cytometric analysis of co-expression of CD62L and CD44 molecules on the surface of different subpopulations of CD8+ T-lymphocytes in spleen 12 days after immunization with EL4 thymoma cells. Splenocytes of (A) wild-type B10.D2(R101) and (B) 1D1bFM transgenic mice on genetic background B10.D2(R101) were ex vivo isolated from intact (left panel) and immunized (right panel) mice, stained by antibodies, and analyzed. Upper panels show CD8+Vb6− T-lymphocytes and bottom panels shown CD8+Vβ6+ T-lymphocytes. Data from one representative staining are shown. Similar results were obtained in three independent experiments. Only singlets were gated for analysis. Relative number of CD8+ T-lymphocytes with the surface phenotype CD44+CD62L− in transgenic mice significantly differed from those in wild-type animals, both in control and immunized animals (p < 0.05).
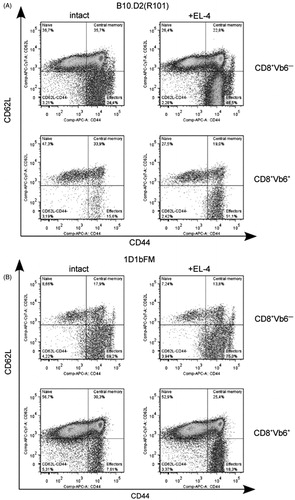
Figure 4. Survival rates of wild-type B10.D2(R101) and 1D1bFM transgenic mice on genetic background B10.D2(R101) after immunization by thymoma EL4 cells. Nine control and nine transgenic mice were immunized with EL4 thymoma cells (2 × 10⁷ cells) and then examined every day up to 80 days thereafter. Similar data were obtained in three independent experiments.
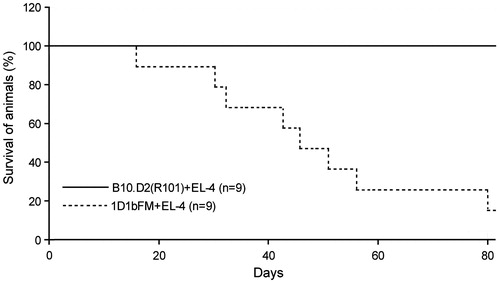
Figure 5. Stable loss of H-2Kb molecule expression on the surface of thymoma cells 30 days after immunization of 1D1bFM transgenic mice. (A) EL4.1b cells were ex vivo isolated from ascites of transgenic 1D1bFM mice, stained by antibodies, and analyzed by flow cytometry (solid line) in a comparison with an original variant of EL4 cells (dotted line). (B) An EL4.1b H-2Kb-negative sub-line was additionally propagated in vitro during 21 days, stained, and analyzed by flow cytometry (solid line) in a comparison with an original variant of EL4 cells (dotted line). This experiment was reproduced 4-times with near-identical results.
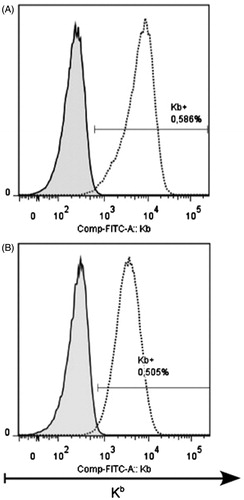
Figure 6. Mice of C57BL/10 strain succumb to injection of both original EL4 and H-2Kb-negative EL4.1b thymoma cells. Mice were intraperitoneally transplanted with original EL4 cells or EL4.1b cells that previously passed immune selection in 1D1bFM mice. Thereafter, mice were examined every day after the transplantation. Differences in lifespan of mice in control and experimental groups were not statistically significant. Each group contained six animals.