Figures & data
Figure 1. Transcriptional profile of resting and activated conventional (Tconv) and TR CD4+ T-cells. (a) Venn diagram of genes differentially-expressed in activated versus resting cells and TR versus Tconv cells. Shaded circle includes genes showing an interaction effect, suggesting that expression of genes in Tconv and TR cells depends on activation status and cell type. Plots inside the Venn diagram show examples of possible gene expression profiles in each section of the diagram. ‘+’ denotes Foxp3GFP+ (TR cells), ‘−’ denotes Foxp3GFP− (Tconv cells), ‘Act’ denotes activated and ‘Rest’ denotes resting T-cells. (b) Venn diagram of genes differentially-expressed in adaptive aTR and resting and activated Tconv cells. Right upper circle = genes differentially-expressed between activated and resting Tconv cells; lower circle = genes differentially-expressed between aTR and resting Tconv cells; left upper circle = genes differentially-expressed between activated Tconv and aTR cells.
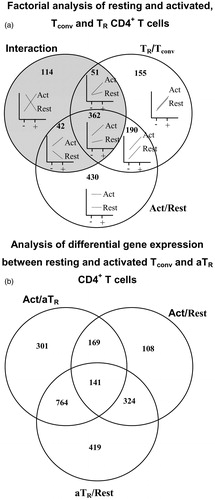
Figure 2. BMPR1α expression in T-cell sub-sets. (a) BMPR1α expression in resting conventional CD4+ T-cells (Tc), TR cells expressing low (TR Fp3lo) and high (TR Fp3hi) levels of Foxp3, cells activated with anti-CD3/anti-CD28 Ab (actTc), adaptive TR cells (aTR), and activated TR cells expressing low (actTR Fp3lo) and high (actTR Fp3hi) level of Foxp3. (b) BMPR1α expression in vivo in resting CD8+ T-cells (Tc), activated CD8+ T-cells (actTc), and in activated CD8+ T-cells isolated from tumor draining lymph nodes (DrTc). Positive control (+Ctrl) is BMPR1α expression in RM-1 cells. (c) BMPR1α expression in CD4+ T-cells activated in vivo by injecting Foxp3GFP mice with SEB. RT-PCR analysis was done on activated CD4+CD44+CD62L−Foxp3GFP− (actTc), naive CD4+CD44−CD62L+Foxp3GFP− T-cells (Tc), and TR cells expressing low (actTR Fp3lo) and high (actTR Fp3hi) levels of Foxp3. (d) Expression of BMPR1α ligands BMP2 and BMP7 in T-cells activated to generate TH1, TH2, and TH17 cells and in in vitro activated TR cells expressing low and high levels of Foxp3.
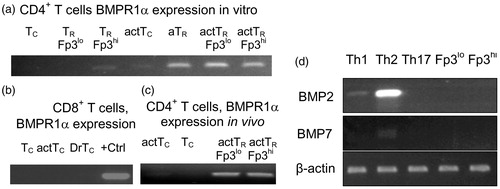
Figure 3. Characterization of BMPR1αT− mice. Panels in the left column are normal Foxp3GFP mice on a C57BL6 genetic background (BMPR1αTwt) and in the right column are BMPR1αT− mice. (a, c) CD4 and CD8 expression on thymocytes and lymph node cells. (b) CD25 and Foxp3 expression on gated CD4+ thymocytes. (d, e) Analysis of CD4 and Foxp3 or CD25 expression on lymph node cells. (f) Expression of activation markers CD44 and CD62L on gated CD4+ lymph node cells. Cells ware stained with indicated antibodies and numbers show percentage of cells in each quadrant of dot-plot. A representative experiment of three (each experiment used 2–3 mice) each is shown.
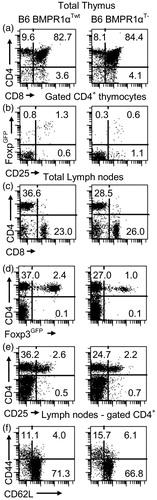
Figure 4. Proliferation and IFNγ production by CD4+ T-cells from BMPR1αTwt (WT, rare dots) and BMPR1αT− (KO, dense dots) mice. (a) Sorted naive CD4+ T-cells were incubated in a 96-well plate without (Columns 1, 2) or with (Columns 3, 4) plate-bound anti-CD3/anti-CD28 antibodies for 4 days and proliferation was measured via [3H]-thymidine incorporation. (b) IFNγ production (ELISA) by conventional CD4+ T-cells stimulated in vitro with plate-bound anti-CD3/anti-CD28 antibodies. All experiments were repeated four times. Columns represent mean values (± SD). Samples were compared using a Student’s t-test. *Statistically significant differences between samples.
![Figure 4. Proliferation and IFNγ production by CD4+ T-cells from BMPR1αTwt (WT, rare dots) and BMPR1αT− (KO, dense dots) mice. (a) Sorted naive CD4+ T-cells were incubated in a 96-well plate without (Columns 1, 2) or with (Columns 3, 4) plate-bound anti-CD3/anti-CD28 antibodies for 4 days and proliferation was measured via [3H]-thymidine incorporation. (b) IFNγ production (ELISA) by conventional CD4+ T-cells stimulated in vitro with plate-bound anti-CD3/anti-CD28 antibodies. All experiments were repeated four times. Columns represent mean values (± SD). Samples were compared using a Student’s t-test. *Statistically significant differences between samples.](/cms/asset/006373e7-033f-422d-b2b9-8db2fb625423/iimt_a_864736_f0004_b.jpg)
Figure 5. Naive sorted CD4+ T-cells from BMPR1αT− mice do not efficiently convert into aTR cells when stimulated with anti-CD3/anti-CD28 antibodies in the presence of TGFβ (3 ng/ml) and IL-2 (50 U/ml) for 3 days. The experiment was repeated at least three times.
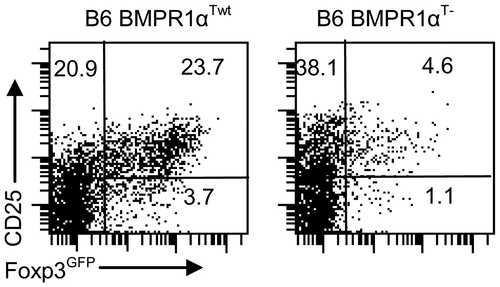
Figure 6. Proliferation inhibition assay. CD4+Foxp3GFP− responder cells (Resp) (4 × 10⁴/well) and TR cells (2 × 10⁴/well) from BMPR1αTwt (WT) or BMPR1αT− (KO) mice cells were stimulated with soluble anti-CD3 antibody (5 µg/ml) in the presence of irradiated splenocytes (5 × 10⁴/well, 3000 Rad). After culturing cells for 3 days, 1 µCi [3H]-thymidine/well was added and proliferation then measured. The percentage proliferation was calculated by comparing proliferation readings from a well with responder cells only to that from a well containing both responder and TR cells. The plot shows a representative experiment (of four). Columns represent mean values (±SD). Samples were compared using s Student’s t-test. *Values between samples of WT and KO mice marked were significantly different at p ≤ 0.05.
![Figure 6. Proliferation inhibition assay. CD4+Foxp3GFP− responder cells (Resp) (4 × 10⁴/well) and TR cells (2 × 10⁴/well) from BMPR1αTwt (WT) or BMPR1αT− (KO) mice cells were stimulated with soluble anti-CD3 antibody (5 µg/ml) in the presence of irradiated splenocytes (5 × 10⁴/well, 3000 Rad). After culturing cells for 3 days, 1 µCi [3H]-thymidine/well was added and proliferation then measured. The percentage proliferation was calculated by comparing proliferation readings from a well with responder cells only to that from a well containing both responder and TR cells. The plot shows a representative experiment (of four). Columns represent mean values (±SD). Samples were compared using s Student’s t-test. *Values between samples of WT and KO mice marked were significantly different at p ≤ 0.05.](/cms/asset/ca63d494-fc52-4935-b5f8-545f05a8d036/iimt_a_864736_f0006_b.jpg)
Figure 7. Size of B16 tumors growing in BMPR1αTwt (•) and BMPR1αT− (—) mice inoculated with B16 melanoma cells (5 × 10⁴ cells, subcutaneously). Nine mice were analyzed in each series. Two measurements [mm] of each tumor (at the largest dimensions, perpendicular to each other) were taken and multiplied (y-axis). The duration of tumor growth is shown on the x-axis. The plot shows average values (±SD) for each timepoint. Differences in tumor sizes between BMPR1αTwt and BMPR1αT− mice were statistically significant for all time-points (p ≤ 0.05). One experiment of two is shown.
![Figure 7. Size of B16 tumors growing in BMPR1αTwt (•) and BMPR1αT− (—) mice inoculated with B16 melanoma cells (5 × 10⁴ cells, subcutaneously). Nine mice were analyzed in each series. Two measurements [mm] of each tumor (at the largest dimensions, perpendicular to each other) were taken and multiplied (y-axis). The duration of tumor growth is shown on the x-axis. The plot shows average values (±SD) for each timepoint. Differences in tumor sizes between BMPR1αTwt and BMPR1αT− mice were statistically significant for all time-points (p ≤ 0.05). One experiment of two is shown.](/cms/asset/805c6e2f-e898-469e-b9c4-ed940295f906/iimt_a_864736_f0007_b.jpg)
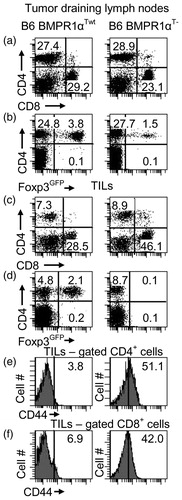
Figure 8. T-cell populations. T-cell levels in (a–d) tumor draining lymph nodes and (e, f) tumors of tumor-bearing BMPR1αTwt (left column) and BMPR1αT− (right column) mice. (a) CD4 and CD8 T-cell populations in tumor draining lymph nodes. (b) Foxp3 expression on CD4+ T-cells in tumor draining lymph nodes. (c) CD4 and CD8 T-cell populations in tumor-infiltrating cells. (d) Foxp3 expression on CD4+ T-cells in tumors. (e, f) CD44 expression on gated CD4+ and CD8+ T-cells in tumors. The plot shows a representative experiment (of three).