Figures & data
Figure 1. Histological changes in livers of AMG-treated rats. Representative H&E staining of (A) control and (B) AMG-treated (125 mg/kg/day, 14 days) rats. Evidence of Zone 3 hepatocyte hypertrophy was found in rats treated with AMG as compared to controls; 20× magnification. (C) Rats treated with AMG had an increase in liver weight that was most significant on Day 7 of treatment. Values shown are mean (±SEM) for each group (n = 4). *p < 0.05 compared to control (Mann--Whitney U-test).
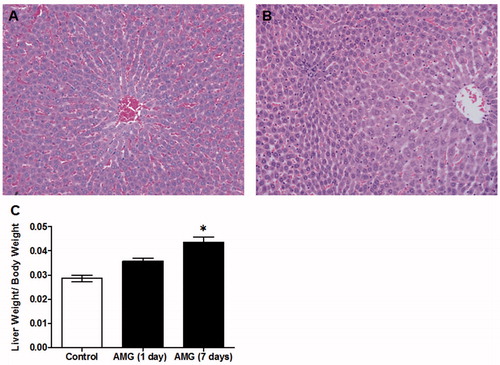
Figure 2. Comparison of hepatocyte proliferation in control and AMG-treated animals. Representative Ki-67 staining in tissue from (A) control and (B) AMG-treated (125 mg/kg/day, 14 days) rats; 20× magnification. (C) A possible increase in Ki-67 was observed at Day 7 of AMG treatment. Although some evidence of hepatocyte proliferation was found in the AMG-treated rats, the main effect was hypertrophy rather than hyperplasia. Open bars = control rats; solid bars = AMG-treated rats. Values shown are mean (±SEM) number of Ki-67-positively-stained nuclei per 10× field of view (n = 4). No results were statistically significant (two-way ANOVA).
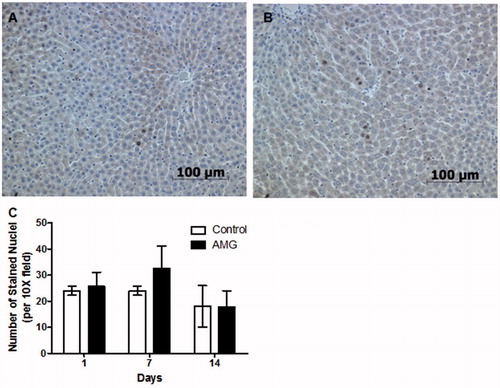
Figure 3. AMG-induced changes in serum levels of liver enzymes. (A) ALT and (B) GLDH in rats treated with AMG (125 mg/kg/day) compared to control rat values. Open bars = control group; solid bars = AMG-treated group. Values shown are mean (±SEM) (n = 4). **p < 0.01 as compared to control (two-way ANOVA).
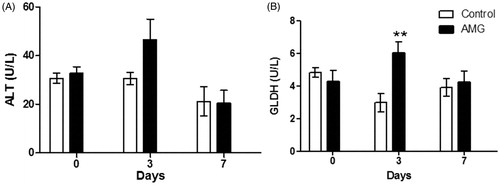
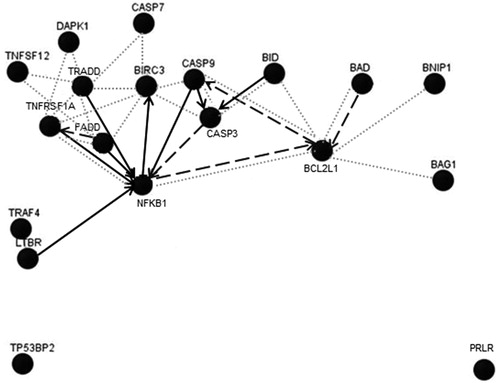
Figure 4. Pathway analysis of significantly changed hepatic genes in the apoptotic pathway in AMG-treated rats. Only genes with changes >2-fold (up-regulation) after 14 days of AMG treatment were included in analysis for trends in the apoptotic panel of genes. Arrows indicate known associations and do not represent how genes are regulated by AMG. Solid lines = up-regulation; dashed lines = down-regulation; dotted lines = physical interaction. Analysis was performed using Gene Network Central Pro software (SABiosciences).