Figures & data
Figure 1. Colony formation and cell death of colorectal tumor cells after treatment with different irradiation protocols. (a) Change in colony formation of SW480 tumor cells after single irradiation with 1 × 15 Gy, norm- (5 × 2 Gy), or hypo-fractionated (3 × 5 Gy) irradiation. Colony formation of non-irradiated tumor cells (w/o) was set to 100% and used as reference. Data shown are mean (±SD) of three independent experiments and displayed in logarithmic scale. (b) Forms of SW480 tumor cell death after exposure to the different irradiation protocols described in (a). Tumor cells were stained with AnxA5-FITC/PI 24 h after the final irradiation unit and then analyzed by flow cytometry. Percentages of viable (AnxA5−/PI−), necrotic (AnxA5+/PI+), and apoptotic (AnxA5+, PI−) tumor cells are demonstrated. Values are means (±SD) of eight independent experiments. Gy, Gray; w/o, non-irradiated tumor-cell controls. *p < 0.05; ***p < 0.001.
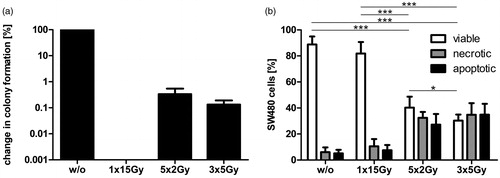
Figure 2. Maturation of DC after incubation with supernatants (SN) of differently irradiated tumor cells. Immature DC (iDC) were co-incubated with the SN of non- or differently irradiated tumor cells for 48 h. Surface expression of DC maturation markers (a) CD25, (b) CD80, and (c) CD83 was then analyzed by flow cytometry. Untreated iDC were used as negative controls. DC matured with a classical maturation cocktail served as positive controls (mDC). Values displayed are mean (±SD) of six independent experiments. DC, dendritic cells; SN, supernatants; Gy, Gray; w/o, non-irradiated tumor cell controls; MFI, mean fluorescence intensity. *p < 0.05; **p < 0.01.
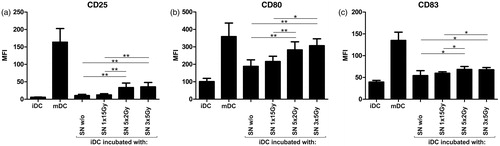
Figure 3. Cytokine secretion by DC after incubation with SN of differently irradiated tumor cells. SN of non- or differently irradiated tumor cells were added to immature DC cultures (iDC) for 48 h. The DC cytokine secretion profiles were then determined by Cytometric Bead Array (a) IL-12p70, (b) IL-8, (c) IL-6, (d) TNFα, (e) IL-1β, and (f) IL-10. iDC were applied as negative controls. DC matured with a classical maturation cocktail served as positive controls (mDC). Mean values (±SD) of six independent experiments are illustrated. DC, dendritic cells; SN, supernatants; Gy, Gray; w/o, non-irradiated tumor cells. *p < 0.05; **p < 0.01.
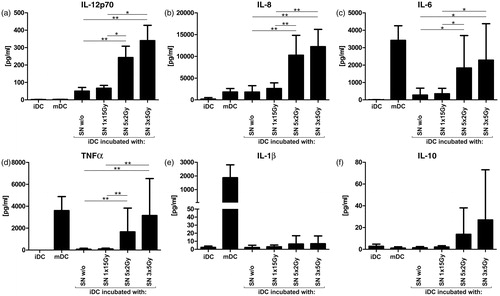
Figure 4. CD4+ T-cell proliferation and activation after co-incubation with allogeneic iDC matured with SN of differently irradiated tumor cells. CD4+ T-cells were stained with CFSE and co-incubated with allogeneic iDC that had been incubated with the SN of non- or differently irradiated tumor cells for 48 h. After (a) day 4 or (b) day 5, CD4+ T-cell proliferation was assessed by CFSE fluorescence decrease. (c) Additional staining with CD3-V450, CD4-PerCP Cy5.5, and CD25-PE antibodies ensured the separation between CD4+ T-cells and DC and identified the amount of activated CD4+ T-cells. CD4+ T-cells co-incubated with DC matured with a classical maturation cocktail (mDC) served as positive controls. Unstimulated CD4+ T-cells (without DC co-incubation) were used as baseline controls. Results shown are mean (±SD) of four independent experiments. DC, dendritic cells; SN, supernatants; Gy, Gray; w/o, non-irradiated tumor-cell controls. *p < 0.05.
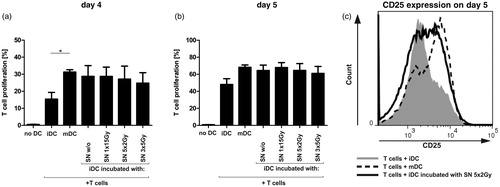
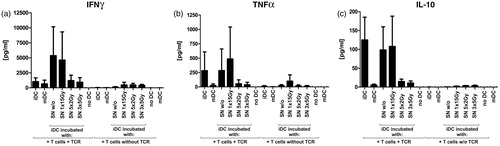
Figure 5. Antigen-specific CD4+ T-cell stimulation by peptide-loaded DC matured with the SN of differently irradiated tumor cells. Immature DC (iDC) were co-incubated with the SN of non- or differently irradiated SW480 tumor cells loaded with MAGE A3-peptide and co-incubated for 24 h with autologous CD4+ T-cells that were transfected with a T-cell receptor specific for MAGE-A3/HLA-DP4. Specific CD4+ T-cell stimulation was determined by amount of cytokines secreted: (a) IFNγ, (b) TNFα, and (c) IL-10. Reference values result from CD4+ T-cells co-incubated with iDC or matured DC (mDC) generated with a classic maturation cocktail. Mock-electroporated CD4+ T-cells were used as unspecific controls (T-cells without TCR). Cytokine secretion profiles of mDC without further CD4+ T-cell co-incubation are displayed for comparison. Data illustrated are means (±SD) of four independent experiments with T-cells and DC of four different healthy donors. DC, dendritic cells; SN, supernatants; Gy, Gray; w/o, untreated tumor-cell controls; TCR, specific T-cell receptors.