Figures & data
Table 1. Body weight gain and relative weights of organs of rats exposed daily to CdCl2, TRE, or a TRE + Cd co-treatment for 2 weeks.
Figure 1. Hepatic, thymic, and splenic Cd contents in rats treated with CdCl2 alone or plus TRE with different doses for 14 days. Values shown are mean (±SEM). *Value significantly different (p < 0.05) compared to control and all co-treatment rats in corresponding tissue.
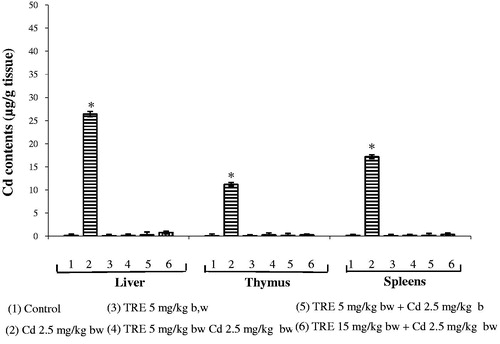
Table 2. Effects of daily treatment with TRE alone or in combination with CdCl2 for 2 weeks on serum biochemical parameters.
Figure 2. Effect of TRE and Cd alone or in combination on percentages of T-lymphocytes in blood of rats treated with CdCl2 alone or plus TRE with different doses for 14 days. (a) CD8+, CD56+. (b) CD3+, CD4+. Values shown are mean (±SEM). *Value significantly different (p < 0.01) compared to control and all co-treatment rats.
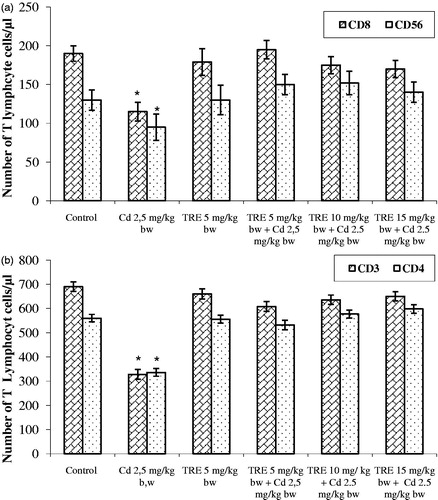
Figure 3. Effect of different treatments on immunoglobulin induction profile in rats treated with CdCl2 alone or plus TRE with different doses for 14 days. Values shown are mean (±SEM). *Value significantly different (p < 0.01) compared to control and all co-treatment rats.
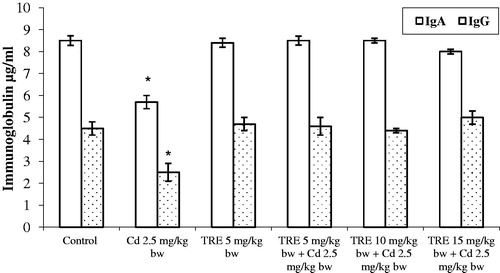
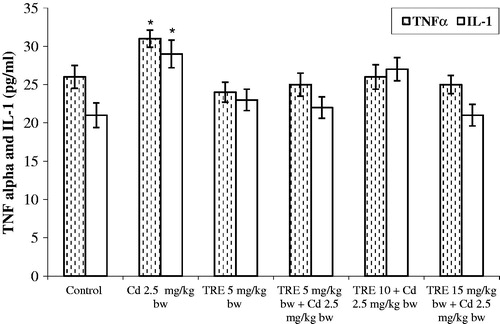
Figure 4. Effect of TRE and Cd (alone or in combination) on plasma TNFα and IL-1 levels in rats treated with CdCl2 alone or plus TRE with different doses for 14 days. Values shown are mean (±SEM). *Value significantly different (p < 0.01) compared to control and all co-treatment rats.