Figures & data
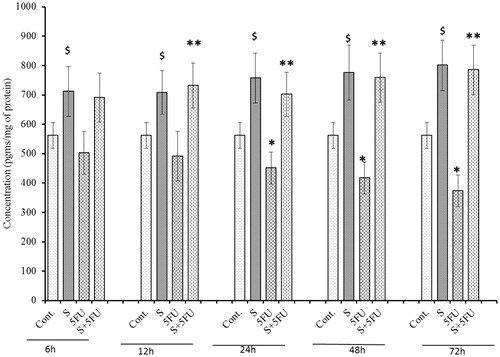
Figure 1. Effect of SQGD and/or 5-FU treatment on G-CSF expression in serum. Mice were treated with SQGD and/or 5-FU and blood samples were collected at different timepoints for subsequent analysis. C, Control; S, SQGD-treated mice; 5-FU, 5-FU only-treated mice; S + 5FU, Mice pre-treated with SQGD 2 h before 5-FU treatment. All values shown are mean ± SD (n = 6 mice/treatment group for each timepoint). Values significantly different: $p < 0.05, SQGD versus control;*p < 0.05, 5-FU only versus control; **p < 0.05, SQGD + 5-FU versus 5-FU only.
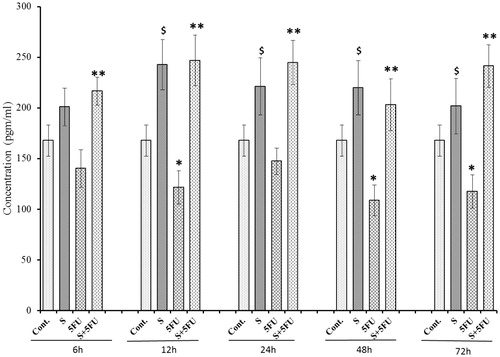
Figure 2. Influence of SQGD on 5-FU-mediated inhibition in serum GM-CSF expression. C, Control; S, SQGD-treated mice; 5-FU, 5-FU only-treated mice; S + 5FU, Mice pre-treated with SQGD 2 h before 5-FU treatment. All values shown are mean ± SD (n = 6 mice/treatment group for each timepoint). Values significantly different: $p < 0.05, SQGD versus control; *p < 0.05, 5-FU versus control; **p < 0.05, SQGD + 5-FU versus 5-FU only.
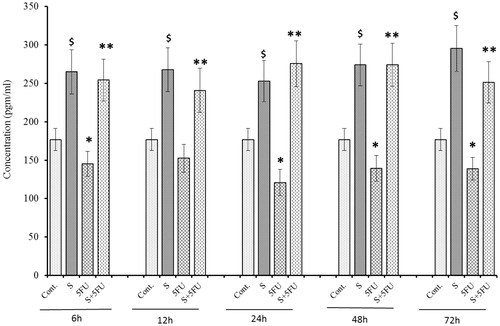
Figure 3. Analysis of M-CSF expression in serum of mice treated with SQGD and/or 5-FU. C, Control; S, SQGD-treated mice; 5-FU, 5-FU only-treated mice; S + 5FU, Mice pre-treated with SQGD 2 h before 5-FU treatment. All values shown are mean ± SD (n = 6 mice/treatment group for each time-point). Values significantly different: $p < 0.05, SQGD versus control; *p < 0.05, 5-FU only versus control; **p < 0.05, SQGD + 5-FU versus 5-FU only.
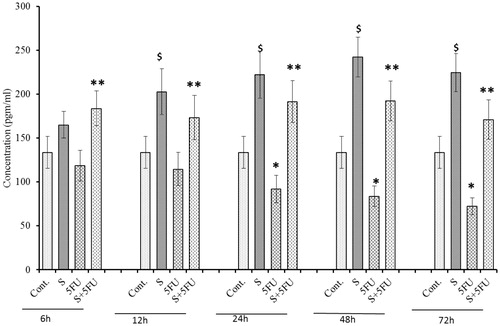
Figure 4. Effect of SQGD and/or 5-FU treatment on G-CSF expression in the spleen. Mice were treated with SQGD and/or 5-FU and spleen samples were then collected at different timepoints and processed for analysis. C, Control; S, SQGD-treated mice; 5-FU, 5-FU treated mice; S + 5FU, Mice pre-treated with SQGD 2 h before 5-FU treatment. All values shown are mean ± SD (n = 6 mice/treatment group for each timepoint). Values significantly different: $p < 0.05, SQGD versus control; *p < 0.05, 5-FU only versus control; **p < 0.05, SQGD + 5-FU versus 5-FU only.
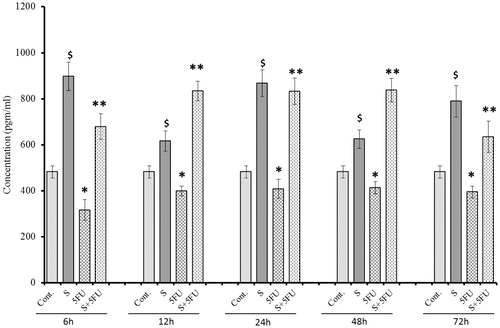
Figure 5. Influence of SQGD on 5-FU-mediated modulation of GM-CSF expression in spleen. C, Control; S, SQGD-treated mice; 5-FU, 5-FU only-treated mice; S + 5FU, Mice pre-treated with SQGD 2 h before 5-FU treatment. All values shown are mean ± SD (n = 6 mice/treatment group for each timepoint). Values significantly different: $p < 0.05, SQGD versus control; *p < 0.05, 5-FU versus control; **p < 0.05, SQGD + 5-FU versus 5-FU only.
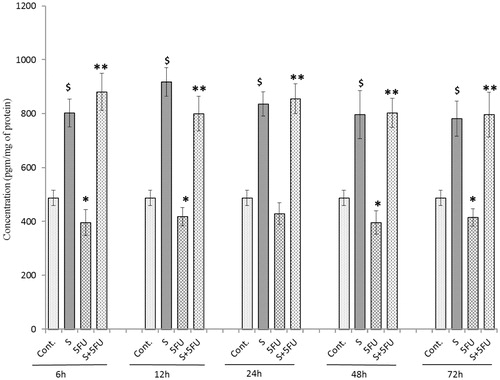
Figure 6. Analysis of M-CSF expression in the spleen of mice treated with SQGD and/or 5-FU. C, Control; S, SQGD-treated mice; 5-FU, 5-FU only-treated mice; S + 5FU, Mice pre-treated with SQGD 2 h before 5-FU treatment. All values shown are mean ± SD (n = 6 mice/treatment group for each timepoint). Values significantly different: $p < 0.05, SQGD versus control; *p < 0.05, 5-FU-only versus control; **p < 0.05, SQGD + 5-FU versus 5-FU only.
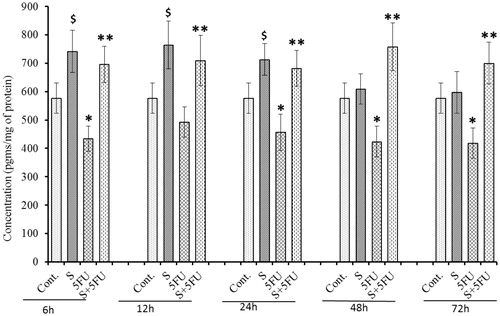
Figure 7. Effect of SQGD and/or 5-FU treatment on bone marrow cell G-CSF expression. Mice were treated with SQGD and/or 5-FU and bone marrow cells were then collected at different timepoint for analysis. C, Control; S, SQGD-treated mice; 5-FU, 5-FU only treated mice; S + 5FU, Mice pre-treated with SQGD 2 h before 5-FU treatment. All values shown are mean ± SD (n = 6 mice/treatment group for each timepoint). Values significantly different: $p < 0.05 SQGD versus control; *p < 0.05, 5-FU-only versus control, **p < 0.05, SQGD + 5-FU versus 5-FU only.
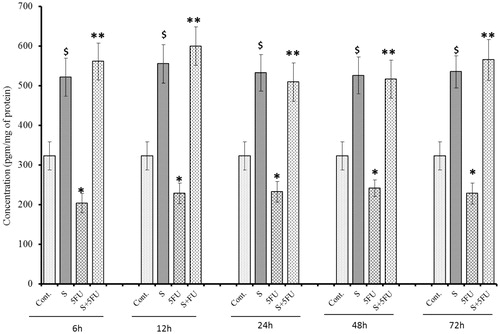
Figure 8. Influence of SQGD on 5-FU-mediated modulation of bone marrow cell GM-CSF expression. C, Control; S, SQGD-treated mice; 5-FU, 5-FU only-treated mice; S + 5FU, Mice pre-treated with SQGD 2 h before 5-FU treatment. All values shown are mean ± SD (n = 6 mice/treatment group for each timepoint). Values significantly different: $p < 0.05, SQGD versus control; *p < 0.05, 5-FU only versus control; **p < 0.05, SQGD + 5-FU versus 5-FU only.
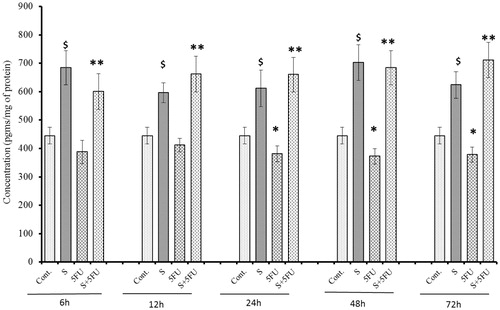
Figure 9. Analysis of M-CSF expression in bone marrow cells of mice treated with SQGD and/or 5-FU. C, Control; S, SQGD-treated mice; 5-FU, 5-FU-only treated mice; S + 5FU, Mice pre-treated with SQGD 2 h before 5-FU treatment. All values shown are mean ± SD (n = 6 mice/treatment group for each timepoint). Values significantly different: $p < 0.05, SQGD vs control; *p < 0.05, 5-FU only vs control; **p < 0.05, SQGD + 5-FU vs 5-FU only.