Figures & data
Figure 1. Lung inflammation in SRA knockout mice after repetitive ODE exposures. Mice were intra-nasally treated with saline or organic dust extract (ODE) daily for 3 weeks. A representative 4–5-µm thick section (H&E stained) of one mouse per treatment group is shown (10 × magnification). (a) Wild-type (WT) SRA+/+ + saline. (b) Knockout (KO) SRA−/− + saline. (c) WT + ODE. (d) KO + ODE. (e) Mean semi-quantitative distribution of inflammatory scores of lung lymphoid aggregates, alveolar inflammation, and bronchiolar inflammation in mice (n = 4–5 mice/group). Error bars represent SE. Statistically significant (***p < 0.001) versus saline. #p < 0.05 and ###p < 0.001: significant differences between groups as indicated (1-way ANOVA with Tukey’s post-hoc comparison). Line scale represents 100 µm.
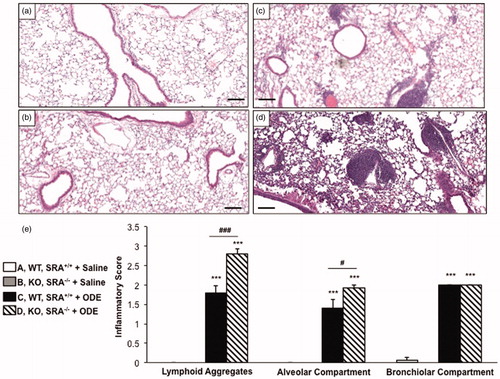
Figure 2. Lung inflammation in SRA KO following 1 week recovery after repetitive ODE exposures. Mice intra-nasally treated with saline or ODE daily for 3 weeks and subsequently rested (no intra-nasal treatments) for a 1 week recovery phase. A representative 4–5-µm thick section (H&E stained) of one mouse per treatment group is shown (10 × magnification). (a) Saline. (b) Wild-type (WT) SRA+/+ treatment group. (c) KO SRA−/− treatment group. (d) Mean semi-quantitative distribution of inflammatory scores of lung lymphoid aggregates, bronchiolar inflammation and alveolar inflammation in mice (n = 4–5 mice/group). Error bars represent SE. Statistically significant (*p < 0.05, **p < 0.01, ***p < 0.001) versus saline. #p < 0.05 and ##p < 0.01: significant differences between groups as indicated (1-way ANOVA with Tukey’s post-hoc comparison). Line scale represents 100 µm.
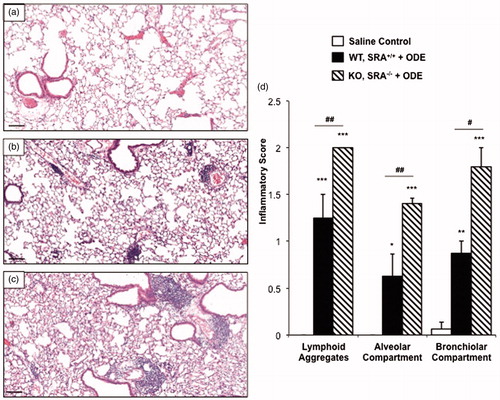
Figure 3. Lavage fluid cell (type) levels indicative of recruitment after repetitive ODE treatments and following the 1 week recovery. Mice (WT and SRA KO) were intra-nasally treated with saline or ODE daily for 3 weeks (repetitive ODE) or ODE daily for 3 weeks followed by no treatments for 1 week (recovery ODE). Results shown are means (±SEM) bronchoalveolar lavage fluid counts of total cells, macrophages, neutrophils, and lymphocytes as determined by hemocytometer (n = 4–8 mice/group). Statistically significant (**p < 0.01, ***p < 0.001) versus saline. #p < 0.05, ##p < 0.01, ###p < 0.001: significant differences between groups as indicated by line (one-way ANOVA with Tukey’s post-hoc comparison).
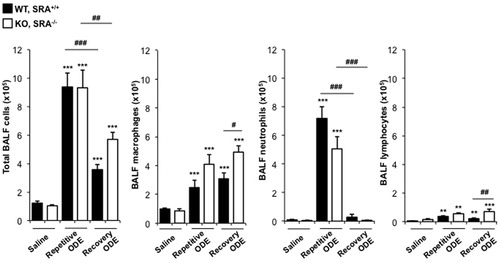
Figure 4. Total lung cells and lung neutrophils following repetitive ODE treatments and 1 week recovery in SRA KO mice. Mice were intra-nasally treated with saline or ODE daily for 3 weeks (repetitive ODE) or treated daily for 3 weeks followed by no treatment for 1 week (recovery ODE) whereupon mice were euthanized, lavage fluid removed, pulmonary vasculature perfused, and lung cells dissociated. (a) Mean total lung cells as determined by hemocytometer. (b) Mean total neutrophils (% LY6G+ neutrophils (see Supplemental Figure 1) of CD45+ cells [as determined by flow cytometry] multiplied by total lung cells) in WT and SRA KO mice. Error bars represent SE. Statistical significance (*p < 0.01, **p < 0.01, ***p < 0.001) versus saline. ###p < 0.001: significant difference between WT repetitive ODE and WT recovery ODE (1-way ANOVA with Tukey’s post-hoc test). n = 5–8 mice/group.
![Figure 4. Total lung cells and lung neutrophils following repetitive ODE treatments and 1 week recovery in SRA KO mice. Mice were intra-nasally treated with saline or ODE daily for 3 weeks (repetitive ODE) or treated daily for 3 weeks followed by no treatment for 1 week (recovery ODE) whereupon mice were euthanized, lavage fluid removed, pulmonary vasculature perfused, and lung cells dissociated. (a) Mean total lung cells as determined by hemocytometer. (b) Mean total neutrophils (% LY6G+ neutrophils (see Supplemental Figure 1) of CD45+ cells [as determined by flow cytometry] multiplied by total lung cells) in WT and SRA KO mice. Error bars represent SE. Statistical significance (*p < 0.01, **p < 0.01, ***p < 0.001) versus saline. ###p < 0.001: significant difference between WT repetitive ODE and WT recovery ODE (1-way ANOVA with Tukey’s post-hoc test). n = 5–8 mice/group.](/cms/asset/b43aa645-f88a-4341-83c9-cfcef32a2d29/iimt_a_882449_f0004_b.jpg)
Figure 5. Exudative CD11chi/CD11bhi macrophages in lungs of WT and SRA KO mice after repetitive ODE exposure and following the 1 week recovery. Mice were intra-nasally treated with saline control or ODE daily for 3 weeks (repetitive ODE) or treated daily for 3 weeks followed by no treatment for 1 week (recovery ODE) whereupon mice were euthanized, lavage fluid removed, pulmonary vasculature perfused, and lung cells dissociated and analyzed by flow cytometry. Initial gating on CD45+ lung leukocytes excludes debris, lymphocytes, and neutrophils, and a plot identified CD11c versus FSC identifies CD11c+ cells (see Supplemental Figure 1). Next, a plot of CD11c versus CD11b distinguishes alveolar macrophages and exudative macrophages (top panel, a). (b, bottom panel) Numbers of macrophages were calculated by multiplying the percentage of macrophages in respective gate (percentage of all CD45+ cells, as analyzed by FACS) multiplied by total lung cells (determined using a hemocytometer) for each mouse. Data shown are means ± SEM of 5–8 mice/group. Statistically significant (**p < 0.01, ***p < 0.001) versus saline. #p < 0.05: significant difference between SRA deficient mice (1-way ANOVA with Tukey’s post-hoc test).
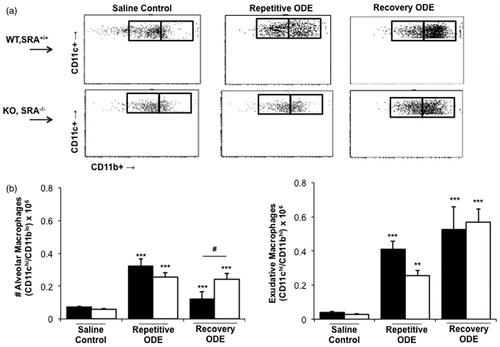
Figure 6. CD4+ lymphocyte recruitment in SRA KO mice following repetitive ODE exposure and after the 1 week recovery. Mice were treated and processed as outlined in the legend. Lymphocytes identified by CD45+ leukocytes excluding debris and characteristic FSC and SSC properties of lymphocytes (see Supplemental Figure 1) followed by staining for CD3, CD4, and CD8. Total numbers of each lymphocyte population were determined by multiplying the frequency of CD3+CD4+ cells or CD3+CD8+ cells (among the CD45+ leukocytes) by the total number of cells (determined by hemocytometer) for each mouse. Data shown are means ± SEM of 5–8 mice/group. Statistically significant (***p < 0.001) versus saline. ###p < 0.001: significant difference between SRA KO and WT mice (1-way ANOVA with Tukey’s post-hoc test).
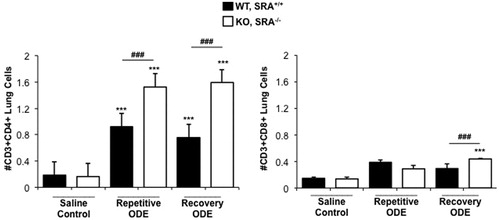
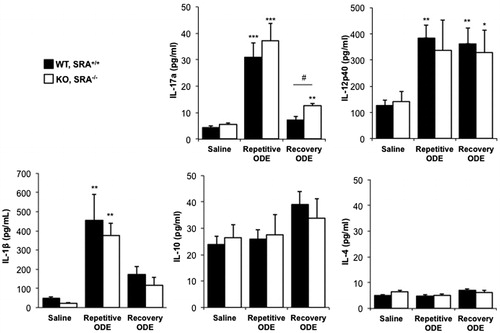
Figure 7. ODE exposure-induced TH17/TH1-polarized cytokine response in lung. Mice were intra-nasally treated with saline or ODE daily for 3 weeks (repetitive ODE) or treated daily for 3 weeks followed by no treatment for 1 week (recovery ODE), whereupon they were euthanized, lavage fluid removed, pulmonary vasculature perfused, and half of their lung tissue was homogenized. Cytokine profiles (associated with T-cell sub-sets) were analyzed from cell-free supernatants of the homogenates using protein multiplex immunoassay and ELISA. Results shown are means ± SEM of 5–8 mice/group. #p < 0.05: significant difference between SRA-deficient and WT mice (1-way ANOVA with Tukey’s post-hoc test). Statistically significant (*p < 0.05, **p < 0.01, ***p < 0.001) versus saline.