Figures & data
Figure 1. Treatment schedule. (A) Extract of P. aquilinum (30 g/kg/day) was administered by gavage once daily for 14 days, and then daily (5 days/week) during an 11-week period in which some mice were also treated with urethane (1 g/kg) once weekly via IP injection. (B) The same regimens were used for assessment of lung lesion development, except that an additional 20 week post-treatment period was adopted (one that contained no treatments in it) to permit observations to be made.
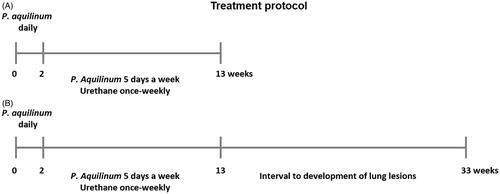
Figure 2. Body weight gain of mice treated with P. aquilinum (P) (30 g/kg/day) by gavage once daily for 14 days, followed by gavage 5 dys/week during an 11-week period that was accompanied by treatment with urethane (U) (1 g/kg) via once-weekly IP injection. #p < 0.001 versus Co group, *p < 0.001 versus P group, Bonferroni’s post-hoc test. n = 5 mice/group.
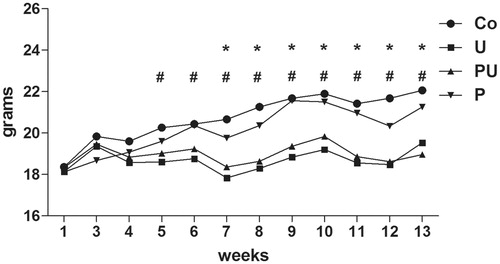
Figure 3. Splenic NK cell cytotoxicity (median) of mice treated with P. aquilinum (P) (30 g/kg/day) by gavage once daily for 14 days, followed by gavage 5 days/week during an 11-week period that was accompanied by treatment with urethane (U) (1 g/kg) or PBS (Co) via once-weekly IP injection. *p < 0.05 versus Co group, Dunn’s post-hoc test. n = 5 mice/group.
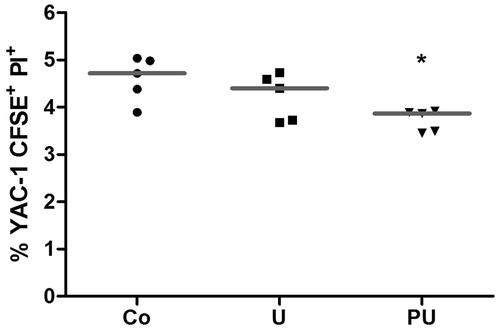
Figure 4. Nodules were observed upon gross examination of the lungs from mice that were treated with P. aquilinum (P) (30 g/kg/day) by gavage once daily for 14 days, followed by gavage 5 days/week during an 11-week period that was accompanied by treatment with urethane (U) (1 g/kg) via once-weekly IP injection. (A) Photo of representative lung with nodules (arrows). (B) Incidence of lung nodules (#p < 0.0001 and RR = 3 versus Co group, Fisher’s exact test). (C) Number of lung nodules/mouse and medians (#p < 0.001 versus Co and P groups, Dunn’s post-hoc test). (D) Multiplicity and medians (#p < 0.001 versus Co group, *p < 0.01 versus P group, and p < 0.05 versus U group, Dunn’s test). Number of mice per group was: Co = 25, U = 25, PU = 25, and P = 24.
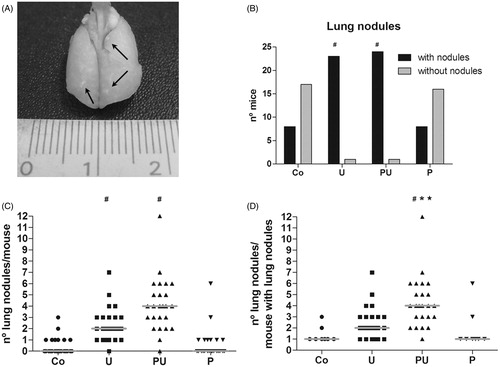
Figure 5. Urethane-induced pre-neoplastic lung lesions in mice treated during an 11-week period with urethane (1 kg/g) via once-weekly IP injection. (A) Bronchiolization (bronchiolar subvariant) (arrow). (B) Alveolar epithelial hyperplasia (arrow). (C) Bronchial epithelial hyperplasia (arrow). Bar = 50 µm.
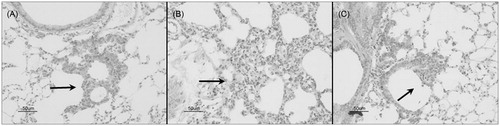
Figure 6. Urethane-induced benign lung tumors in mice treated during 11-week period with urethane (1 mg/g), via once-weekly IP injection. (A) Mixed sub-types adenoma. Bar = 50 µm. (B) Papillary adenoma. Bar = 100 µm.
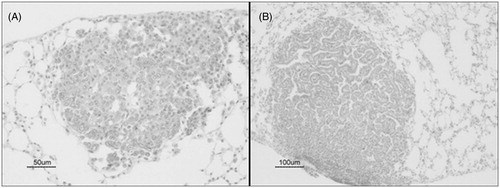
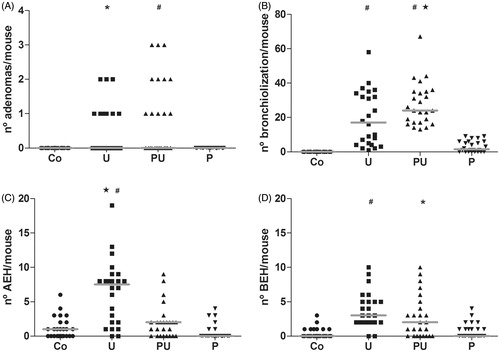
Figure 7. Urethane-induced lung lesions of mice treated with P. aquilinum (P) (30 g/kg/day) by gavage once daily for 14 days, followed by gavage 5 days/week during an 11-week period that was accompanied by treatment with urethane (U) (1 g/kg) via once-weekly IP injection. (A) Adenomas (#p < 0.001 versus Co and P groups, *p < 0.05 versus Co and P groups, Tukey’s post-hoc test) (B) Bronchiolization (#p < 0.001 versus Co and P groups and p < 0.05 versus the U group, Tukey’s test). (C) Alveolar epithelial hyperplasia (#p < 0.001 versus Co and P groups and p < 0.05 versus U group, Dunn’s post-hoc test). (D) Bronchial epithelial hyperplasia (#p < 0.001 versus Co and P groups and *p < 0.01 versus Co group, Dunn’s test). Data are presented as median and range values. Number of mice per group was: Co = 25, U = 24, PU = 25, and P = 24.