Figures & data
Figure 1. Melanoma growth and metastases in IRF-8 KO and WT mice. (a) WT and IRF-8 KO mice were injected SC with 0.8 × 10⁶ B16.F10 melanoma cells and tumor size measured thereafter. Bars represent mean tumor diameter (± SD). One representative experiment of seven is shown. *p < 0.05, **p < 0.01, ***p < 0.001. (b) WT and IRF-8 KO mice were injected IV with B16.F10 cells (1.5 × 10⁶) and euthanized 5 days later for enumeration of lung metastatic foci. Photographs of representative isolated lungs show foci (indicated by dark areas inside lung tissue).
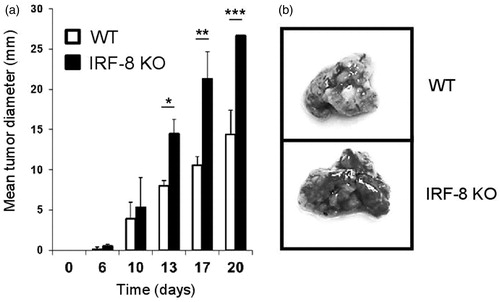
Figure 2. Trafficking of T-lymphocytes, DC, and MDSC in melanoma lesions during tumor progression. Melanoma lesions from WT and IRF-8−/− mice were excised at various stages of growth. (a) Flow cytometric analysis of infiltrating T-lymphocytes gated on total (CD45+CD11c−) leukocytes as CD4+ and CD8+ T-lymphocytes, respectively. Each circle depicts mean percentage value of various infiltrating immune cell populations among total CD45+ cells in each indicated size group (n = 18 mice) ± SD. (b) Melanoma-bearing IRF-8−/− and WT mice were examined at an early tumor size (12-mm diameter). Flow cytometric analysis of MDSC in tumor bulks was then performed. Histograms show MDSC cells as CD11b+Gr1+CD124/IL-4R+ gated. Histograms depict mean percent positive cells among all CD45+ leukocytes. One representative experiment of three is shown. (c) Melanoma-bearing IRF-8−/− and WT mice were sacrificed at Days 7, 14, and 21 post-injection and MDSC from their spleens were analyzed by flow cytometry. Each circle depicts mean percentage values of various infiltrating immune cell populations (among total CD45+ cells) in each indicated size group. One representative experiment of two is shown. *p < 0.05, **p < 0.01, ***p < 0.001.
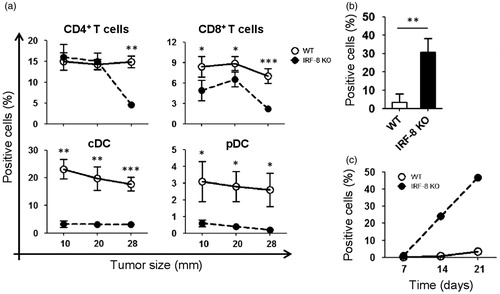
Figure 3. IRF-8 expression in IRF-8-melanoma lesions. (a) IRF-8 mRNA expression in melanoma isolated from WT and IRF-8 KO mice at indicated tumor sizes. Circles represent mean expression values normalized to β-actin in each group (18 mice) ± SD. One representative experiment of three is shown. (b) IRF-8 mRNA expression in sorted CD45+ and CD45− fractions from melanoma-bearing mice at medium stage (20-mm mean diameter). Vertical scatter plots represent mRNA expression values normalized to β-actin. Vertical lines with bars in each group depict the mean mRNA expression ± SD. One representative experiment of three is shown. (c) Spleen cells of melanoma-bearing or naïve WT and IRF-8 KO mice (n = 6) were co-cultured with B16.F10 cells in a 0.4-µm pore size trans-well culture system. After 24 h, the melanoma cells were collected, total RNA was isolated, and qRT-PCR for IRF-8 mRNA was performed. Horizontal scatter plots represent mRNA expression values normalized to β-actin. Horizontal lines with bars in each group depict the mean mRNA expression ± SD. One representative experiment of two is shown. *p < 0.05, **p < 0.01, ***p < 0.001.
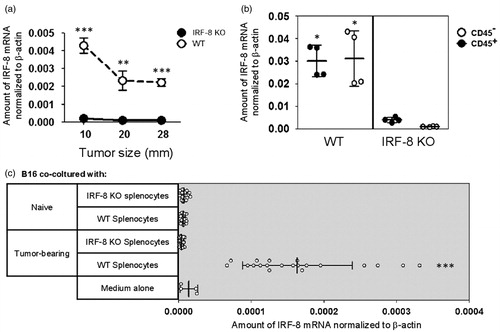
Figure 4. Schematic of PDMS device used for microfluidic studies of melanoma–spleen cell cross-talk. (a) Three-dimensional representation of device. Arrows depict loading wells. Black arrows, B16.F10 wells; white arrows, medium wells; grey arrows, spleen cell wells. (b) Two-dimensional drawing of device. Top panel shows indicated structural components of microfluidic device. The two cell-loading chambers are connected to the central end-closed chambers by four microchannel arrays. Lower panels depict geometry of microchannel arrays, with indicated measurement values. The space between each microchannel is 33 µm; each and all indicated chambers are characterized by the same size shown for the central chamber.
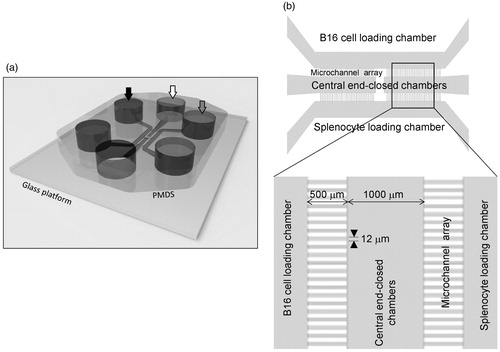
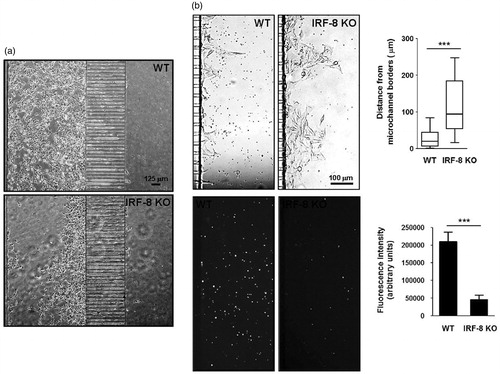
Figure 5. WT and IRF-8 splenocyte migratory profiles towards melanoma chamber after 48 h. (a) Analysis of time-lapse recordings of devices containing B16.F10 cells co-loaded with indicated spleen cells. Charts plot representative trajectories of WT (n = 4) or IRF-8 KO (n = 5) splenocytes within the in the 24–48 h interval. Each line inside plots depicts a single trajectory and each circle represents the final position of a single cell with respect to the initial “zero point” position. (b) Counts of WT and IRF-8 KO spleen cells that migrated towards B16.F10 chamber in the device. Bars represent mean number cells per mm2 (± SD) at indicated time points. (c) Box & Whiskers plot depicting motility of WT (n = 45) or IRF-8 KO (n = 41) spleen cells in the 24–48 h interval. Upper and lower horizontal lines of boxes represent upper and lower quartiles, respectively. The horizontal line in boxes represents median speed values. Upper and lower whiskers represent maximum and minimum speed values, respectively. *p < 0.05. Data are from one representative experiment out of three.
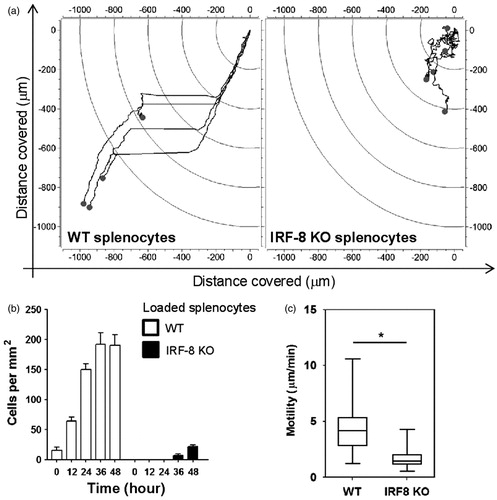
Figure 6. WT and IRF-8 splenocyte interaction ability with melanoma cells in first 48 h. (a) Fibroblastoid B16.F10 cells interacting with splenocytes (small circular cells). Upper panels depict phase-contrast microphotographs; lower panels indicate fluorescence microphotographs of labeled splenocytes. (b) Quantification of fluorescence at 48 h of the splenocytes in devices as shown in (a). Histograms depict total fluorescence intensity of labeled splenocytes of the indicated phenotype. (c) Microphotographs showing time-course of B16-WT splenocyte interactions. Time points and interaction phases occurring are indicated below each microphotograph. Numbers in parentheses depict time-course before and after contact phase.
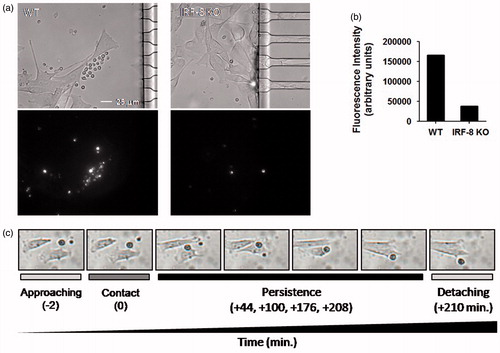
Figure 7. Migratory properties of melanoma cells inside microchannels after 48 h. (a) B16.F10 invasion rate in devices loaded with indicated spleen cells. The plot represents the ratio between the area occupied by B16.F10 cells in each microchannel versus total microchannel area (filling factor). Interpolation curves were obtained by linear regression analysis for the devices loaded with the indicated cells. (b) Detail of microchannel areas of microphotographs used for time-lapse tracking analysis shown in (a). The little black open boxes inside each microchannel indicate migrating B16.F10 cells that had been loaded with the WT or IRF-8 KO mouse splenocytes, at the given time points. (c) Motility of B16.F10 cells when loaded with indicated splenocytes (Box & Whiskers plot). Upper and lower horizontal lines in boxes represent upper and lower quartiles, respectively. Horizontal lines in boxes represent median speed values. Upper and lower whiskers represent maximum and minimum speed values, respectively. (d) Maximum migration distances covered by cancer cells in microchannels from devices loaded with indicated spleen cells. Bars represent mean maximum distance reached by B16.F10 cells in microchannels (± SD). The three values below the graph depict overall distance calculated by adding each single microchannel distance relative to each indicated group (WT, IRF-8 KO, Ctr). Ctr, device loaded with B16.F10 cells alone. Amount of microchannels per group is equal to 31. (e) Detailed schematization of the distance covered by the melanoma cells inside each microchannel. The heat map depicts a global visualization of distance covered by the melanoma cells in each of the 31 microchannels with respect to the three indicated types of splenocytes loaded. Dark and light colors depict higher and lower distances traveled, respectively. ***p < 0.001.
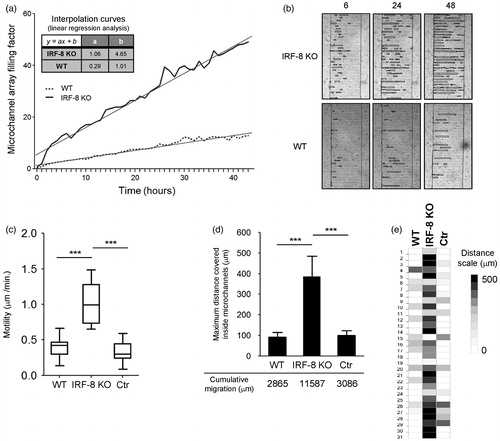
Figure 8. Invasive ability of melanoma cells in response to immune cells at late time points. (a) B16.F10 cell tropism in response to splenocytes. Phase contrast microphotographs show behavior of cells in devices loaded with indicated splenocytes (after 96 h). (b) Extravasation extent of B16.F10 cells. Upper microphotographs depict B16.F10 cells extravasating from microchannels in devices loaded with spleen cells (after 120 h). Upper-right Box & Whiskers plot indicates extravasation extent. Upper and lower horizontal lines of boxes represent upper and lower quartiles, respectively. Horizontal lines in boxes represent median speed values. Upper and lower whiskers represent maximum and minimum speed values, respectively. Lower panels illustrate red fluorescence from the same images of labeled WT and IRF-8 KO mouse splenocytes, migrating towards cancer cells. Lower-right plot shows fluorescence intensity of indicated splenocytes (after 120 h). Bars represent the mean fluorescence ± SD. ***p < 0.001.