Figures & data
Figure 1. Magnetic resonance imaging: coronal proton density fat saturation image (Cor PD-fs FSE) (normal bone is grey while that infiltrated and vascularized becomes bright; fat signal suppression improves the contrast in fat-rich tissues). Note the nodular pattern of signal and decrease in signal intensity along intra-bone and intravenous DLI procedure (106 MNC/kg BW separated from a primary HSCT donor) using a Cobe Spectra continuous flow separator (COBE BCT inc., Blood Component Technology, Lakewood, CO). Above, the clinical data are provided.
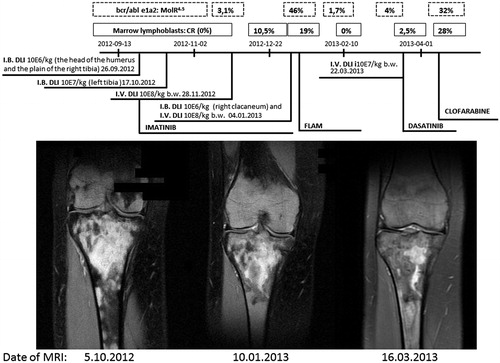
Figure 2. Positive aspiration biopsies for blast cells in the right tibia and in right head of the humerus.
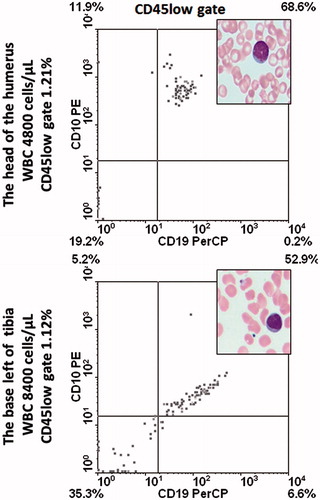
Figure 3. Marrow cell profiling for CD3+ lymphocytes and those CD28+ or HLADR+. Left panels represent analysis made at the time of IB DLI; right ones after completion of this therapy, just prior to the relapse.
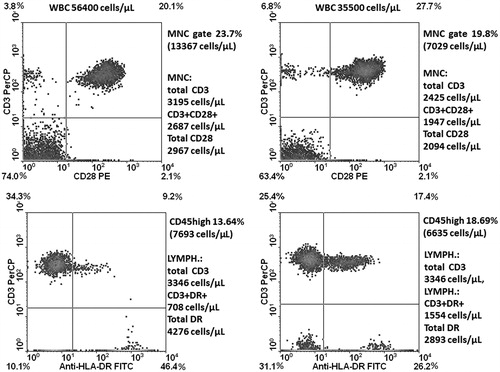
Figure 4. Perforin+ lymphocytes in the marrow after completion of IB DLI prior to relapse.
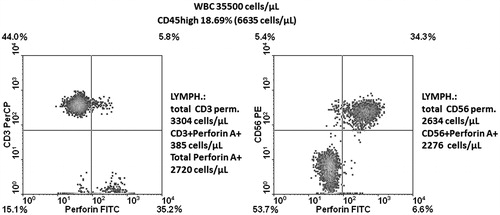
Figure 5. A representative marrow smear (performed after two IB DLI) with a focus on macrophages phagocytizing cellular remnants.
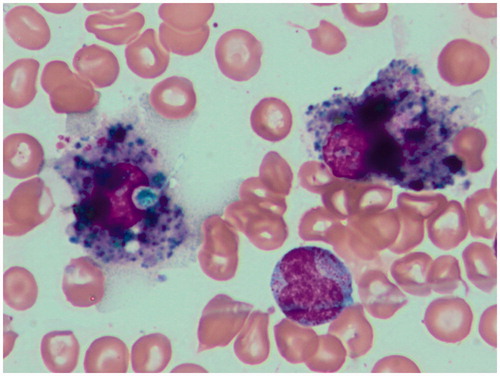
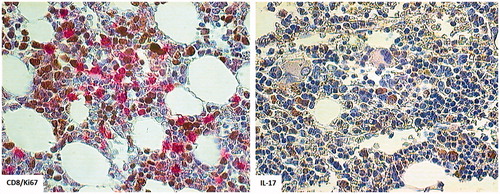
Figure 6. Trephine biopsy taken at the beginning of relapse. Note CD8+ cell (red) in close proximity to Ki67+ blasts (left panel) and IL-17-producing cells (right panel).