Figures & data
Table 1. Characteristics of the study control, PE (and PT) groups.
Table 2. Clinical data for Pb-exposed workers before and after chelation.
Figure 1. Level of lead in blood and urine from Pb-exposed workers. Values shown are from each subject (in terms of μmol/L) before (PE) and after (PT) chelation therapy.
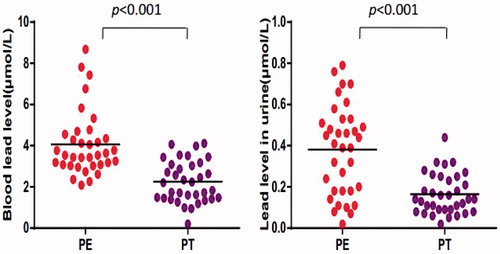
Figure 2. Expression levels of TCRζ, FcɛRIγ, and Elf-1. Levels (%) of (A) TCRζ, (B) FcɛRIγ, and (C) Elf-1 in PMBC recovered from workers before (PE) and after (PT) chelation therapy or from healthy controls (HC).
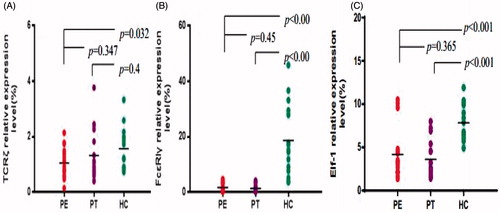
Table 3. Relative TCRζ expression level (%) in PE/PT PBMC as a function of number of therapy rounds.
Table 4. Relative Elf-1 expression level (%) in PE/PT PBMC as a function of number of therapy rounds.
Table 5. Relative FcɛRIγ expression level (%) in PE/PT PBMC as a function of number of therapy rounds.
Figure 3. Correlation analyses for TCRζ and FcɛRIγ expression levels. (A) HC, (B) PE, and (C) PT groups. A significant negative correlation was found for the HC group and a non-significant negative correlation was found for the PE group. There was no correlation for the PT group.
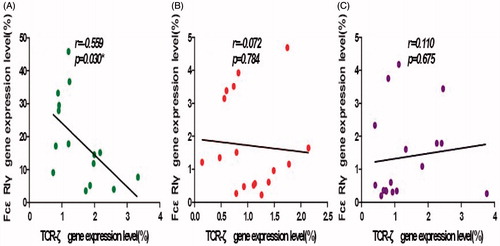
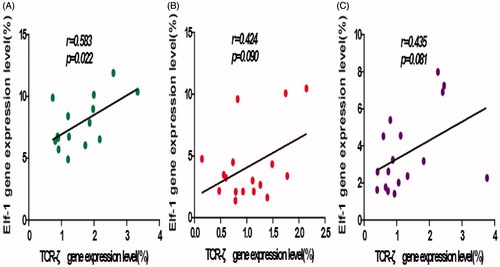
Figure 4. Correlation analyses for TCRζ and Elf-1 expression levels. (A) HC, (B) PE, and (C) PT groups. A significant positive correlation was found in the HC group; non-significant positive correlations were found for the PE and PT groups.