Figures & data
Figure 1. MTT reduction by peritoneal macrophages treated with various levels of clove extract for 48 h. C(A) = Clove (essential oil containing eugenol; ethanolic extract); C(Aq) = Clove (aqueous extract). Values shown are mean ± SD (triplicate samples per dose). *Value significantly different from corresponding control (i.e. with or without LPS) at p < 0.05.
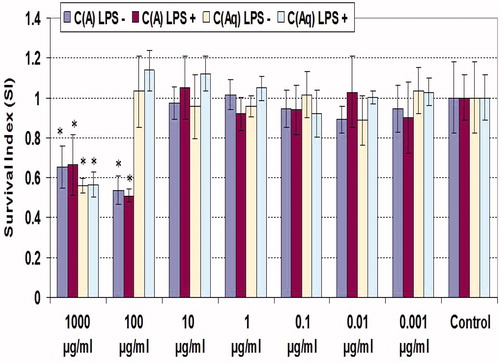
Figure 2. NO production by unstimulated and LPS-stimulated peritoneal macrophages treated with various concentrations of clove ethanolic extract for 48 h. C(A) = Clove (essential oil containing eugenol; ethanolic extract). Values shown are mean ± SD (triplicate samples per dose). *Value significantly different from corresponding control (i.e. with or without LPS) at p < 0.05.
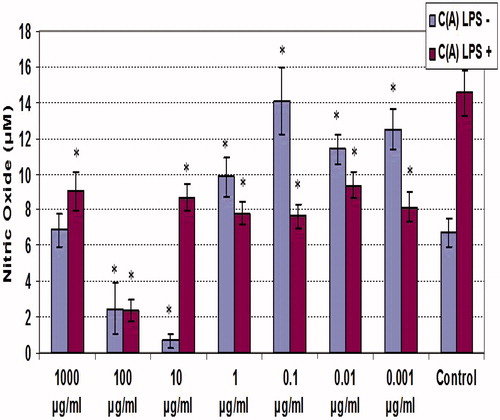
Figure 3. NO production by unstimulated and LPS-stimulated peritoneal macrophages treated with various concentrations of clove aqueous extract for 48 h. C(Aq) = Clove (aqueous extract). Values shown are mean ± SD (triplicate samples per dose). *Value significantly different from corresponding control (i.e. with or without LPS) at p < 0.05.
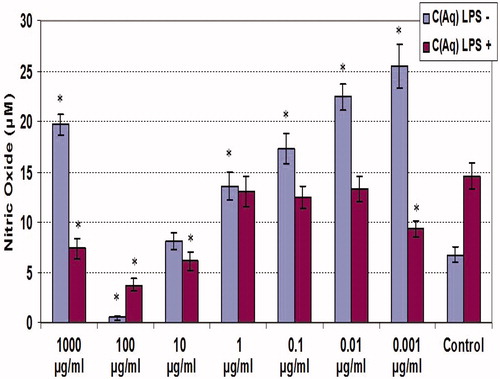
Figure 4. TNFα production by LPS-stimulated peritoneal macrophages co-treated with various concentrations of clove ethanolic or aqueous extracts for 48 h. (a) Ethanolic extract. (b) Aqueous extract. Values shown are mean ± SD (triplicate samples per dose). *Value significantly different from corresponding control (i.e. with LPS) at p < 0.05.
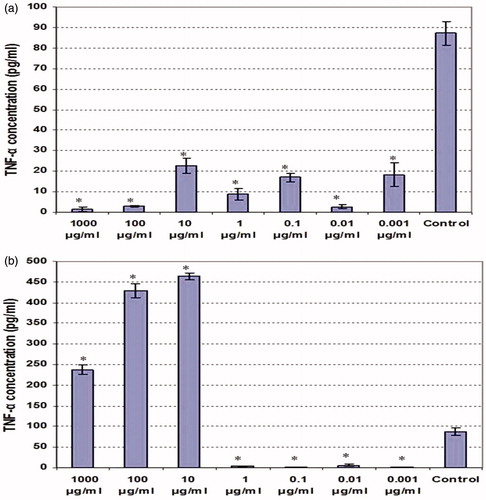
Figure 5. IL-6 production by LPS-stimulated peritoneal macrophages co-treated with various concentrations of clove ethanolic or aqueous extracts for 48 h. (a) Ethanolic extract. (b) Aqueous extract. Values shown are mean ± SD (triplicate samples per dose). * Value significantly different from corresponding control (i.e. with LPS) at p < 0.05.
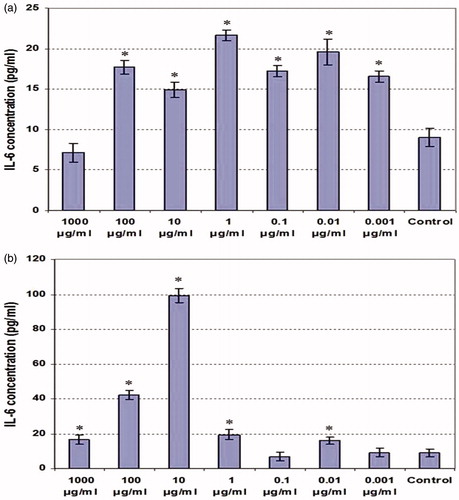
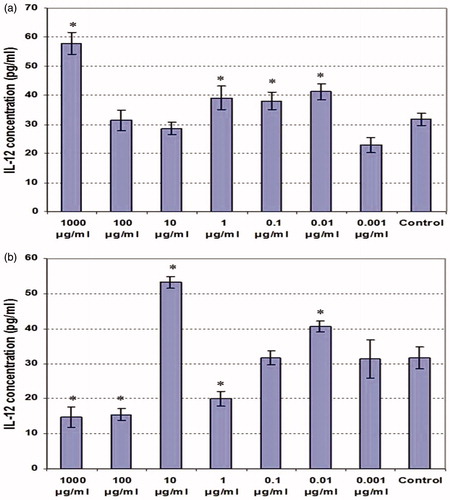
Figure 6. IL-12 production by LPS-stimulated peritoneal macrophages co-treated with various concentrations of clove ethanolic or aqueous extracts for 48 h. (a) Ethanolic extract. (b) Aqueous extract. Values shown are mean ± SD (triplicate samples per dose). *Value significantly different from corresponding control (i.e. with LPS) at p < 0.05.