Figures & data
Table 1. Clinical characteristics, spirometric, hematologic, andserologic findings in study subjects.
Figure 1. Representative 2-D protein patterns of PMN from study subjects. (A) Healthy control. (B) COPD patient. (C) SM-exposed subject. Sample preparation and 2-D analysis was performed as described in Materials and methods. Proteins (500 µg/subject) were separated first using linear IPG strips (pH 4–7) followed by 12% SDS-PAGE. Protein spots were then visualized by colloidal CBB staining.
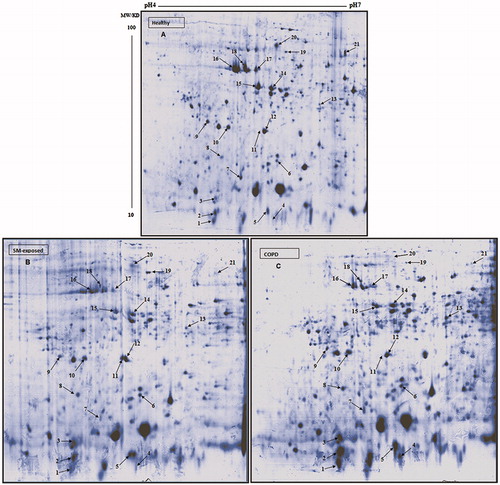
Table 2. Sequence coverage (in %) and MASCOT scores of proteins spots analyzed by MS/Ms.
Table 3. Up-/down-regulated proteins in PMN of SM-exposed and COPD patients versus PMN of healthy controls.
Figure 2. Representative 3-D images of differentially-expressed proteins in PMN. Differentially-expressed proteins spots in lysate from PMN of the same control, SM-exposed, and COPD subject shown in . (A) PDI (Spot 8) and SOD (Spot 6). (B) SerpinB1 (Spot 20) and S100A12 (Spot 2). Data were analyzed using Image master 2-D platinum software.
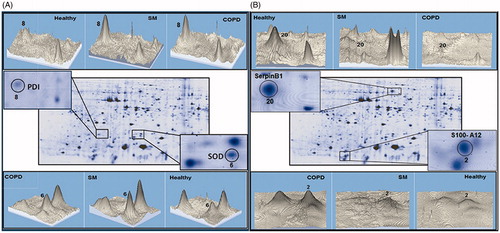
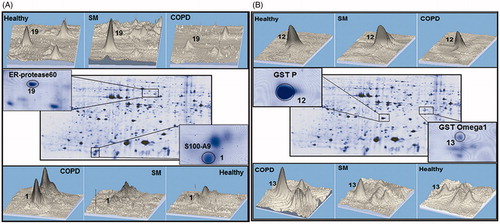
Figure 3. Differenially-expressed proteins in PMN from SM-exposed and COPD patients. Protein spots expressed differently in the PMN of the same SM-exposed and COPD patients shown in . (A) ER-proteses 60 (Spot 19) and S100A9 (spot 1). (B) GSTp (Spot 12) and GST omega1 (Spot 13). The 3-D images of differential spots between the patients were analyzed using ImageMaster 2D Platinum software.