Figures & data
Figure 1. The terpenoid fraction of A. khorassanica. (A) IR spectrum showing absorption of carbonyl function at 1765 cm−1. (B) Expanded 1H-NMR spectrum showing quintet signals of A Protons of saturated γ-lactone ring.
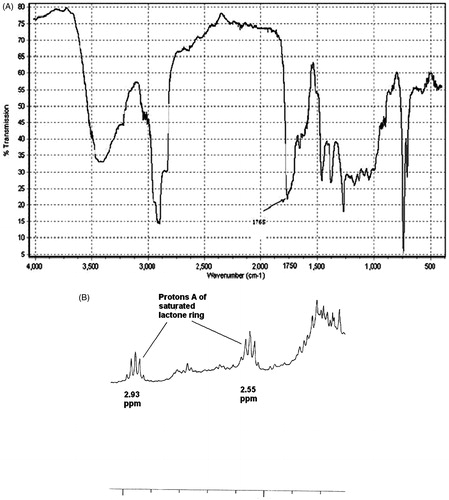
Figure 2. PHA- and LPS-stimulated splenocyte proliferation following SLAK treatment. Proliferation was measured by MTT method. Results shown as mean stimulation index (± SD). Value significantly different vs control at *p < 0.05, **p < 0.01, or ***p < 0.001.
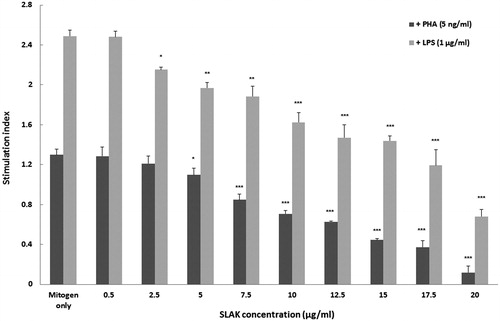
Figure 3. Splenocyte IFNγ and IL-4 production. Isolated splenocytes were treated in vitro with PHA (5 ng/ml) with/without SLAK (5–20 μg/ml) for 3 days. Results are shown as mean ± SD. Value significantly different vs control at *p < 0.05, **p < 0.01, or ***p < 0.001.
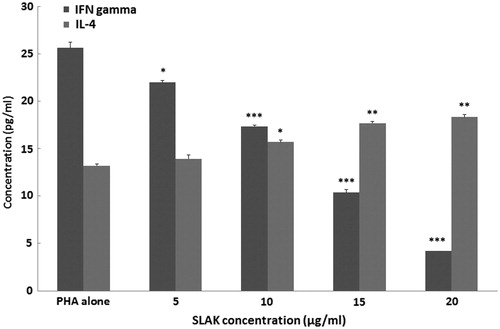
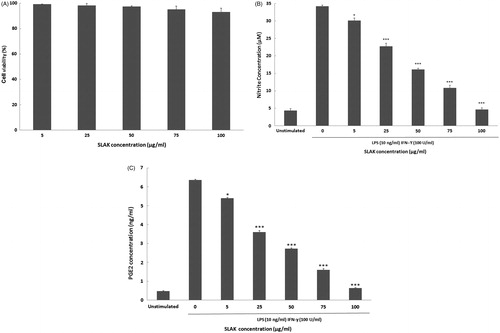
Figure 4. Effect of SLAK on (A) cell viability, (B) NO production, and (C) PGE2 release from peritoneal macrophages after 24 h treatment. Results are shown as mean ± SD. Value significantly different vs control at *p < 0.05, **p < 0.01, or ***p < 0.001.
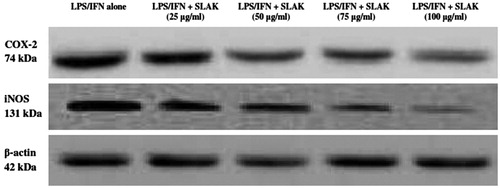
Figures 5. Effect of SLAK on LPS/IFN-induced iNOS and COX-2 expression levels. Lysates were prepared from peritoneal macrophages that were incubated for 24 h with 10 ng LPS/ml + 100 U IFNγ/ml alone or in combination with SLAK (25, 50, 75, and 100 μg/ml). β-actin is shown for housekeeping/gel loading purposes.