Figures & data
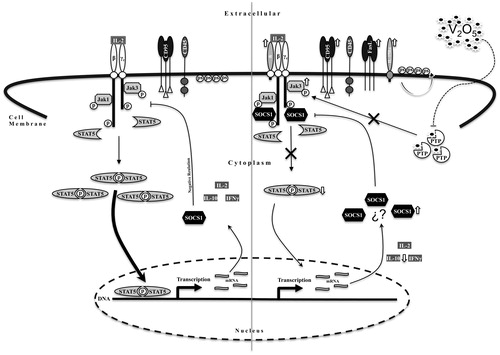
Figure 1. Effect of V2O5 on NK-92MI cell proliferation. Cells were treated with increasing concentrations (25–400 μM) of V2O5 for 48 h. Cells were then stained with CFSE and proliferation of cells determined by flow cytometry. Data are expressed in percentages and each V2O5 concentration is represented with a cytofluorometer histogram (along with respective cell size and granularity dot-plot). Results shown are representative of three different experiments performed with each V2O5 concentration.
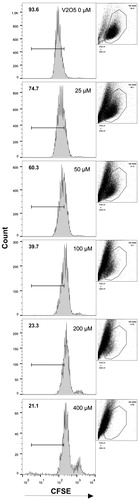
Figure 2. V2O5-induced phosphatidylserine externalization on NK-92MI cells. Cells treated with different V2O5 concentrations for 6, 12, and 24 h and progressive phosphatidylserine externalization examined. Lower right quadrant (Annexin V+7-AAD−) represents early apoptotic cells; upper right quadrant (Annexin V+7-AAD+) represents late apoptotic cells. Lower left quadrant (Annexin V−7-AAD−) represents living cells; upper left quadrant (Annexin V−7-AAD+) represents necrotic cells. Results shown are representative of three different experiments done with each V2O5 concentration.
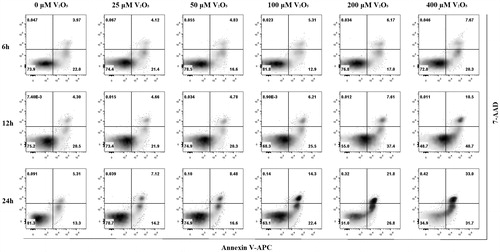
Figure 3. Cytokine production by V2O5-treated NK-92MI cells. IL-2, IL-10, and IFNγ were measured in supernatants of V2O5-treated cells at 6, 12, and 24 h using a cytometric bead array. Results for IL-4, IL-6, IL-17A, and TNFα not shown as levels were below detection by the kit. The results shown are one representative experiment (of three different experiments) performed with each V2O5 concentration. *p < 0.05, **p < 0.01, ***p < 0.001 vs the same V2O5 dose at the different exposure times.
Figure 4. Modifications of cell surface membrane ligands expression in V2O5-treated NK-92MI cells. Expression levels of (a) CD25; (b) IL-15Rα chain; (c) Fas; and (dD) FasL. Results shown are percentage positive cells in relation to expression levels on cells that received respective isotype control. (e) Analysis strategy of cytometry data; image represents data obtained when CD25 expression was evaluated in non-V2O5-treated NK-92MI cells. All data was analyzed using this dot plot strategy.

Figure 5. V2O5 effect on JAK3/STAT-5 activation. NK-92MI cells were treated with medium alone or 25, 50, 100, 200, and 400 μM of V2O5 at 37 °C and then intracellular staining for flow cytometry was performed. Protein levels of JAK3, pJAK3, STAT5, and pSTAT5 were determined after 6, 12, and 24 h of exposure. MFI = mean fluorescence intensity. Results shown are average of three different experiments performed with each V2O5 concentration. *p < 0.01, **p < 0.001 vs the same V2O5 dose at the different exposure times.
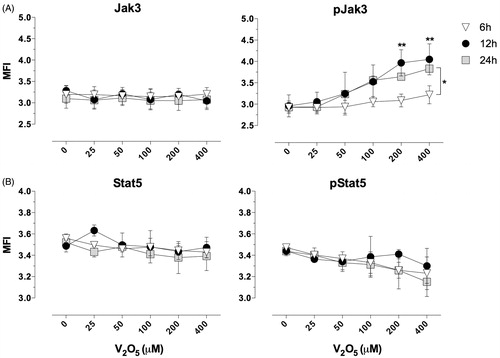
Figure 6. Images of phosphorylation of JAK3 in cells treated with V2O5 for 24 h. The figure shows confocal microscopy images of cells sorted from cytometer. Images on the left of the figure show JAK3, while images on the right show pJAK3. JAK3 and pJAK3 are shown in red; nucleic acid staining marked with SYTOX® green. The first and fifth column show JAK3 and pJAK3, respectively. The second and sixth column show counterstained cell nuclei. The third and seventh column show light microscopy images. The fourth and eighth columns show merged red and green channels. The white bar in the lower right hand section of image represents 20-μm distances.
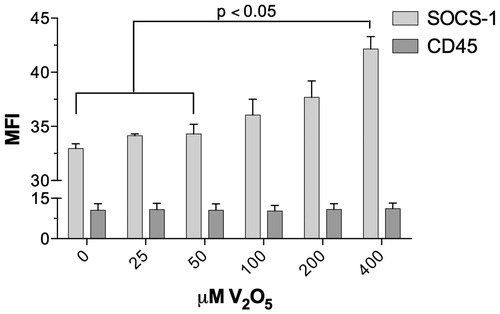
Figure 7. Expression of CD45 and SOCS1 on 92MI NK-cells exposed to V2O5. The graph depicts mean fluorescence intensity (MFI) of CD45 and SOCS1 obtained from FSC-SSC parameters corresponding to the NK-92 MI cell populations.
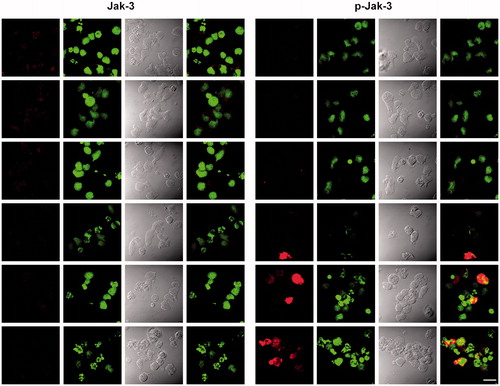
Figure 8. Schematic representation of V2O5 -induced toxicity mechanism. The left-hand side of the figure shows normal signaling pathways activated by IL-2 in NK-92MI cells (in relation to parameters evaluated here). On the right-hand side, graphic representation of effects of V2O5 on the IL-2-induced signaling pathways. Results demonstrated that V2O5 increased JAK3 phosphorylation via possible inhibition of protein tyrosine phosphatase (PTP), that resulted in a decrease in STAT5 phosphorylation. This decrease was also secondary to an increase in SOCS1 synthesis (mechanism of latter remains to be determined). The decrease in STAT5 phosphorylation results in a decrease in inflammatory cytokines synthesis. The increase in cell membrane receptors such as CD95, FasL and both α subunits of IL-2R and IL-15R could be a compensatory mechanism secondary to diminished proliferation signaling activity. Negative regulation of JAK3 phosphorylation mediated by CD45 remained unaltered. Phosphatidylserine translocation to the outside of the membrane was evident.