Figures & data
Figure 1. Effects of thymol and carvacrol on J774.1 cell line viability. The cells were treated with different concentrations of (A) thymol or (B) carvacrol for 24 h. Viability was determined by MTT colorimetic assay. Negative control values were obtained in the absence of components and positive control in the presence of cisplatin (50 µg/ml). Values shown are mean ± SD of three independent experiments in triplicate. *p < 0.05, ***p < 0.001 versus untreated cells.
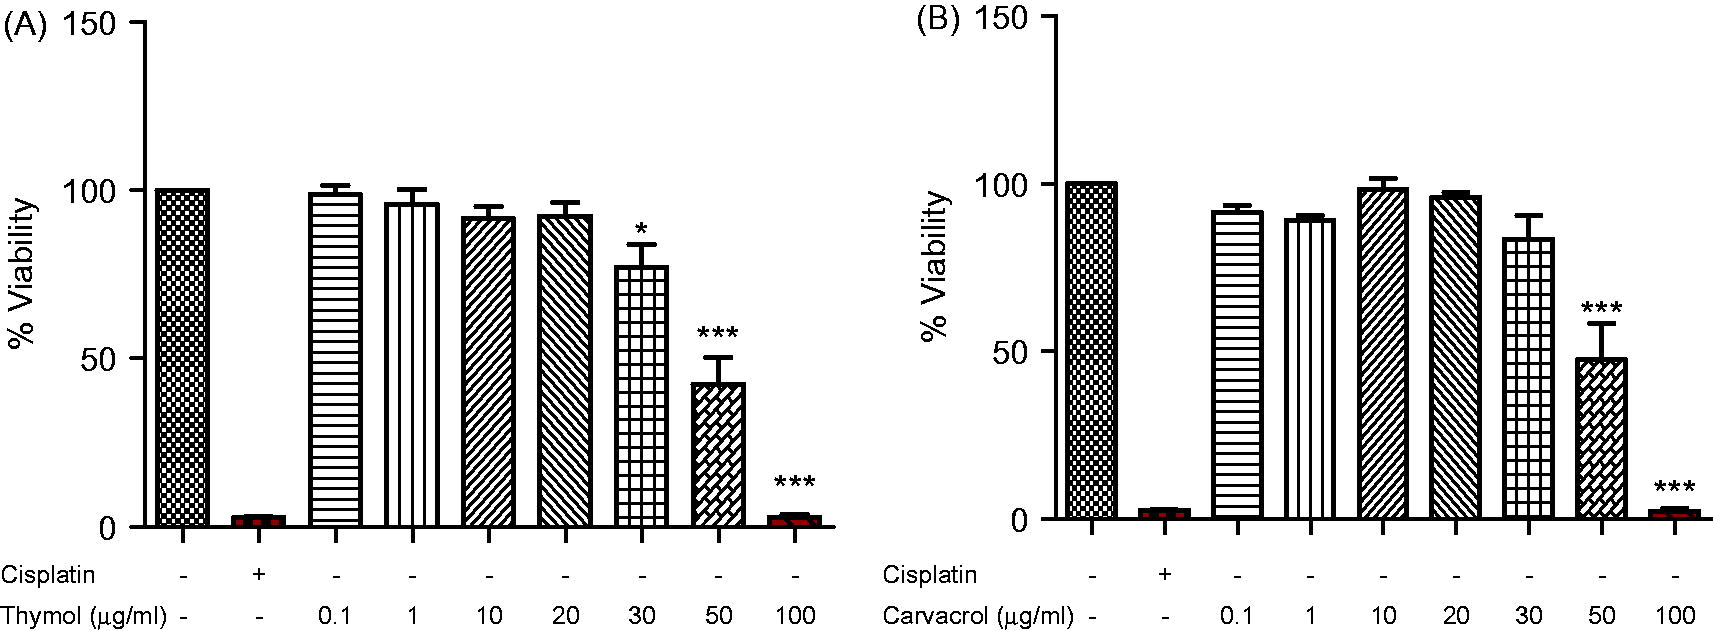
Figure 2. Effects of thymol and carvacrol on LPS-induced inflammatory gene expression. Cells were treated with thymol (Thy: 10 or 20 µg/ml) or carvacrol (Car: 20 or 30 µg/ml) in the presence of 1 µg LPS/ml for 24 h. Expression of IL-1β (A) and TNFα (B) was evaluated using real time-PCR. Negative control (C−) values were obtained in absence of LPS and compounds; positive controls (C+) were cells treated just with LPS. Values shown are mean ± SD of three independent experiments in triplicate. *p < 0.05, **p < 0.01, ***p < 0.001 versus positive control. RFC, relative fold-change.
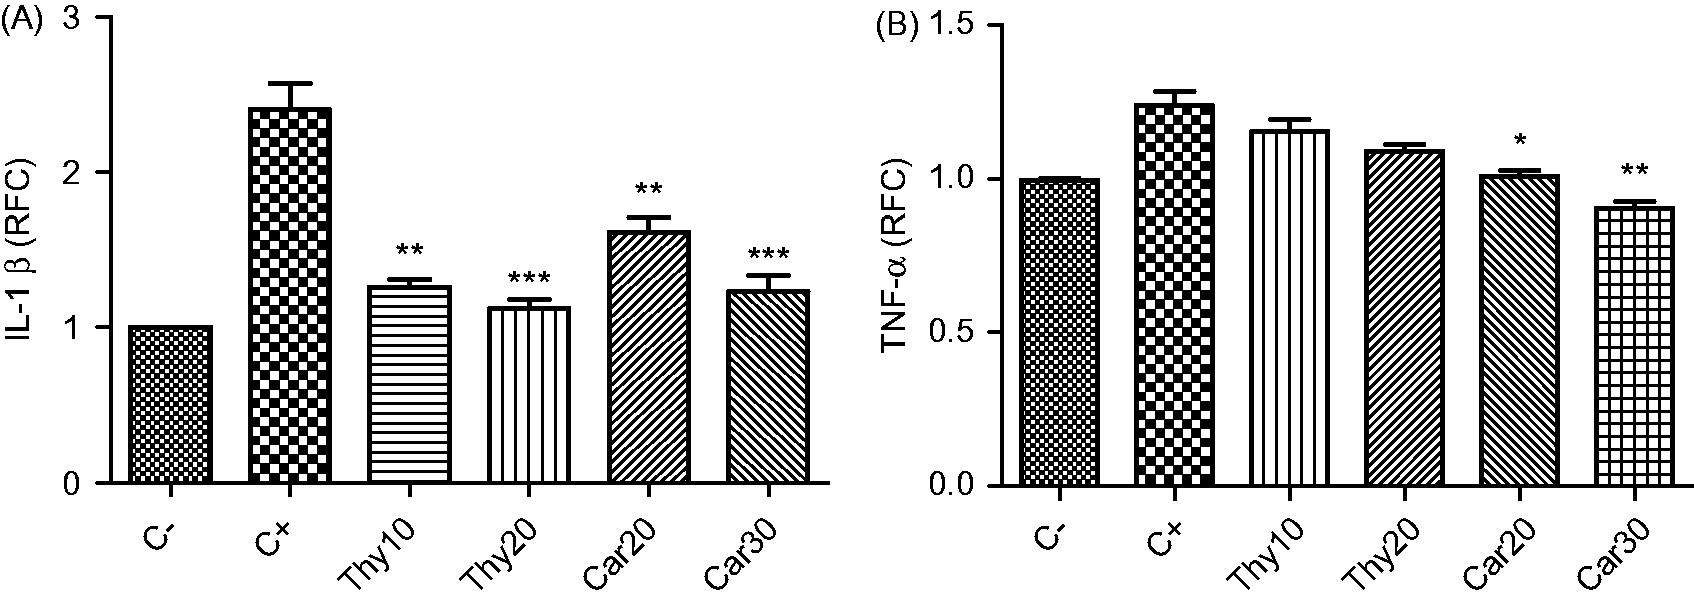
Figure 3. Effects of thymol and carvacrol on LPS-induced inflammatory cytokine levels. Cells were treated with thymol (Thy: 10 or 20 µg/ml) or carvacrol (Car: 20 or 30 µg/ml) in the presence of 1 µg LPS/ml for 24 h. IL-1β (A) and TNFα (B) protein levels were detected using ELISA. Negative control (C−) values were obtained in the absence of LPS and components; positive control (C+) was cells treated only with LPS. Values shown are mean ± SD of three independent experiments in triplicate. **p < 0.01, ***p < 0.001 versus positive control.
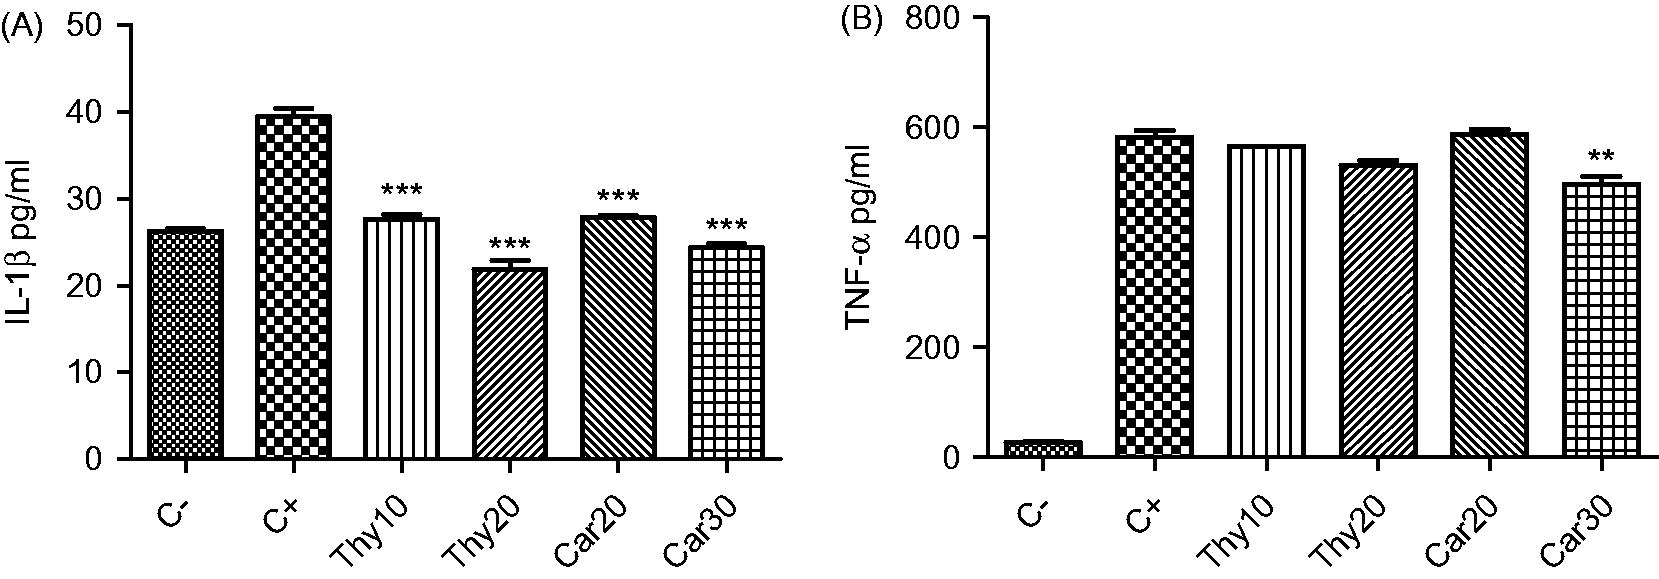
Figure 4. ELISA assessment of effects of thymol and carvacrol on LPS-stimulated inflammatory transcription factor levels. Cells were treated with thymol or carvacrol overnight and subsequently stimulated with 1 µg LPS/ml for 15 min [for detection of p-SAPK/JNK (A), p-STAT-3 (B), p-p38 (C), and p-IκBα (D)] or 30 min [for detection of p-NF-κB p65 (E) and NF-κB p65 (F)]. After total cell lysate preparation, transcription factor levels were measured using a PathScan inflammation multi-target sandwich ELISA. Negative control values were obtained in the absence of LPS and compounds. Positive control was cells treated with LPS only. Values shown are mean ± SD of three independent experiments performed in triplicate. *p < 0.05, **p < 0.01, ***p < 0.001 versus positive control.
![Figure 4. ELISA assessment of effects of thymol and carvacrol on LPS-stimulated inflammatory transcription factor levels. Cells were treated with thymol or carvacrol overnight and subsequently stimulated with 1 µg LPS/ml for 15 min [for detection of p-SAPK/JNK (A), p-STAT-3 (B), p-p38 (C), and p-IκBα (D)] or 30 min [for detection of p-NF-κB p65 (E) and NF-κB p65 (F)]. After total cell lysate preparation, transcription factor levels were measured using a PathScan inflammation multi-target sandwich ELISA. Negative control values were obtained in the absence of LPS and compounds. Positive control was cells treated with LPS only. Values shown are mean ± SD of three independent experiments performed in triplicate. *p < 0.05, **p < 0.01, ***p < 0.001 versus positive control.](/cms/asset/d0040298-def3-4662-828f-056b3b3b4222/iimt_a_1029145_f0004_b.jpg)
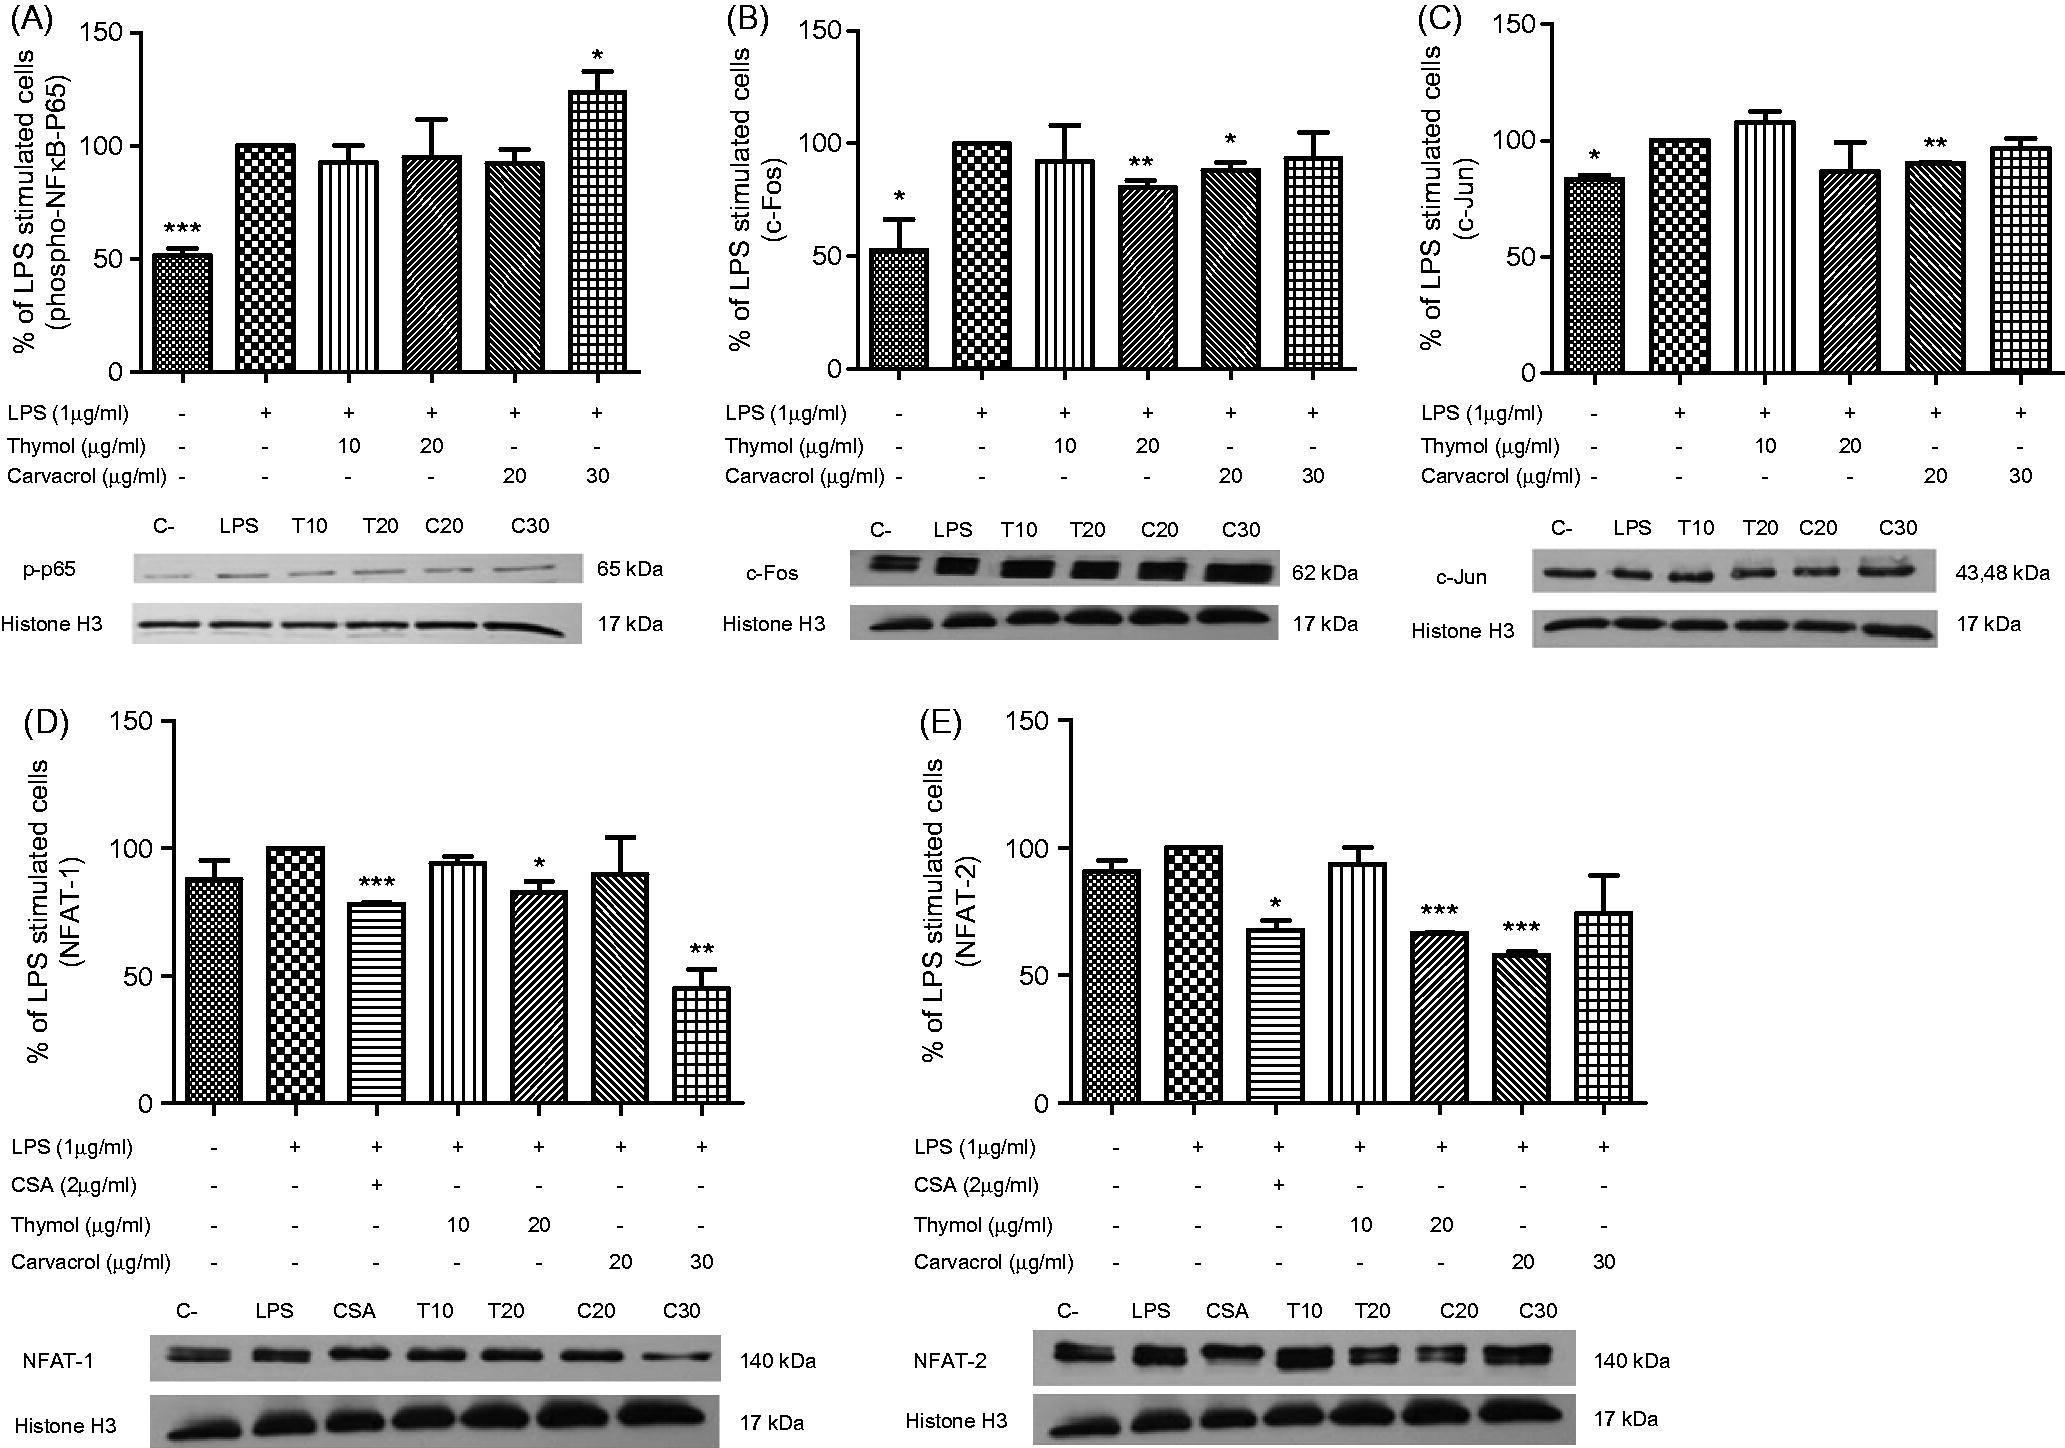
Figure 5. Western blot analysis of thymol and carvacrol effects on LPS-stimulated transcription factors. Cells were treated with 10 or 20 µg/ml of thymol (Thy) or 20 or 30 µg/ml of carvacrol (Car) overnight and then activated with LPS to induce (A) p-NF-κB p65 (P-p65), (B) c-Fos, (C) c-Jun, (D) NFAT-1 and (E) NFAT-2. Expression of each factor in cell nuclear extract was measured using Western blots. Transcription factors levels were normalized to Histone H3 expression using ImageJ software. Negative control (C−) values were obtained in the absence of LPS and compounds. Positive control was cells treated just with LPS. Cyclosporine A (CSA) was used as an NFAT suppressor. Values shown are mean ± SD of three independent experiments performed in triplicate.