Figures & data
Table 1. Experimental design.
Figure 1. Drug effects on SCC VII cells in vitro. Azathioprine and Prednisone show dose responsive effects on SCC VII cells in vitro at high concentrations. Data shown are mean ± SD. * Cell count was significantly less than control (p < 0.05).
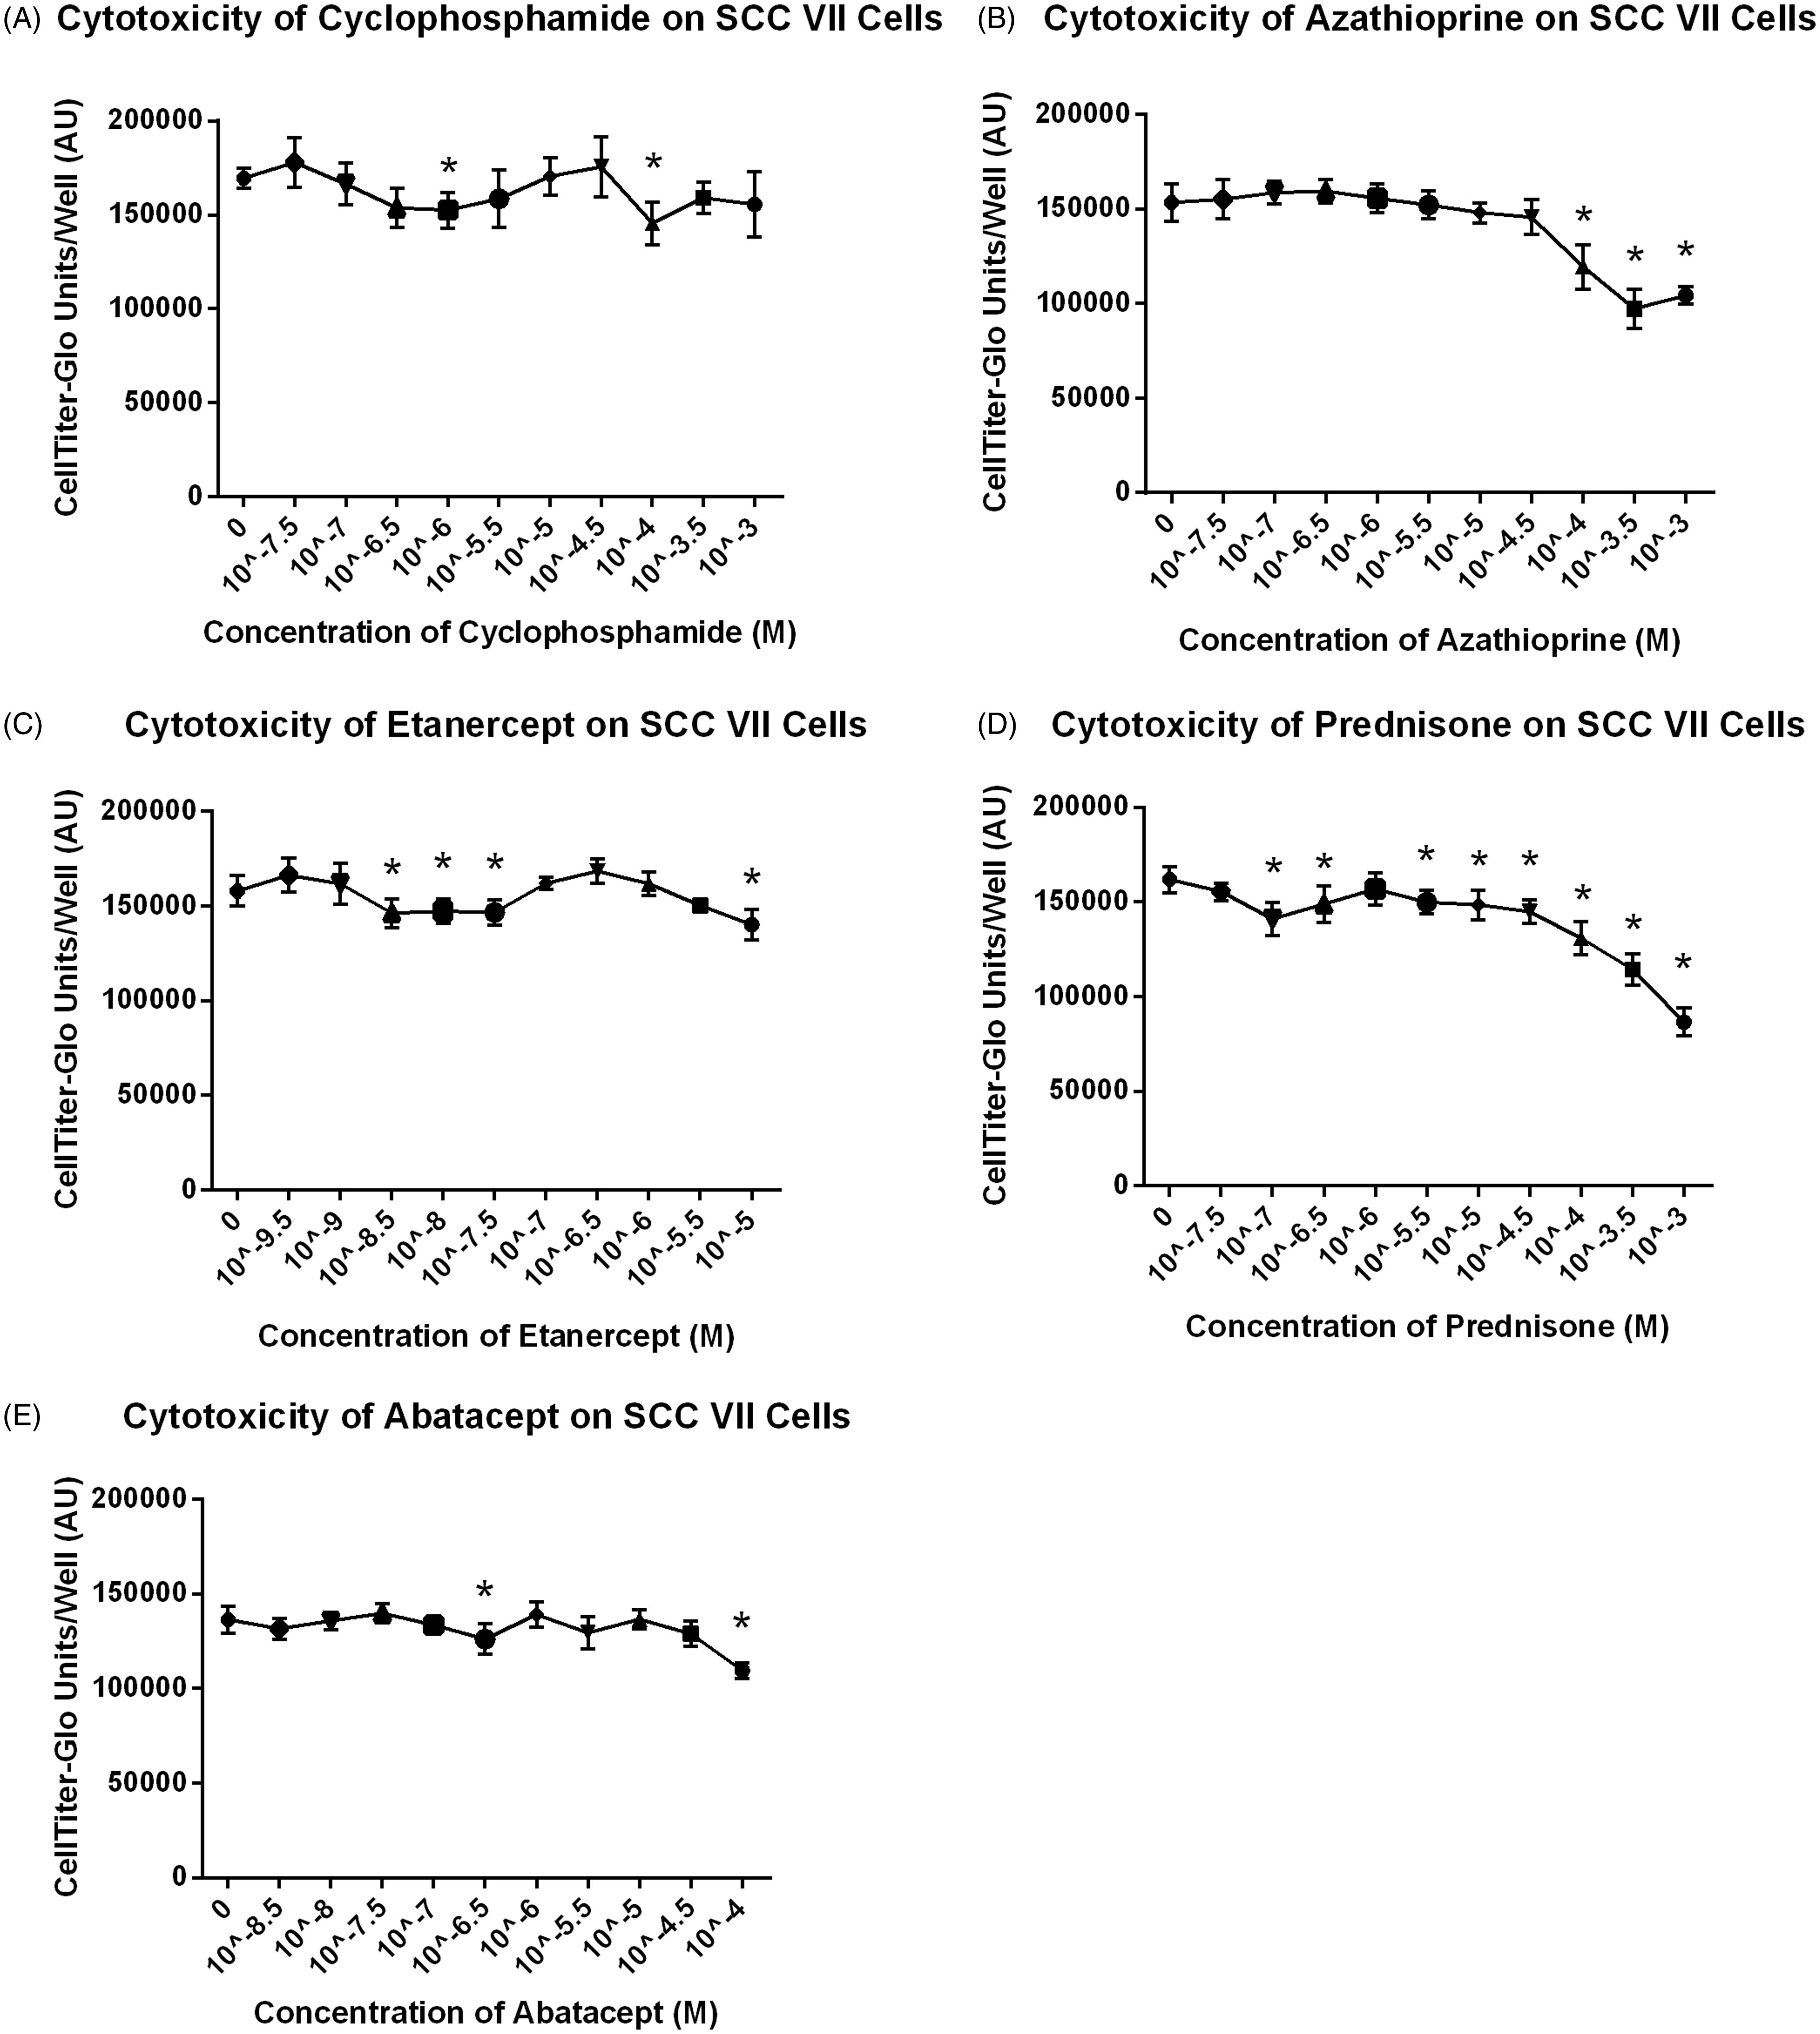
Figure 2. Primary tumor volume increases over time with and without treatment. Data shown are mean ± SD. *At Day 19, Prednisone is significantly less than vehicle control (p < 0.05); n = 12/group. **At Day 24, Prednisone is statistically less than vehicle control and Abatacept is significantly greater than control (p < 0.05); n = 12/group.
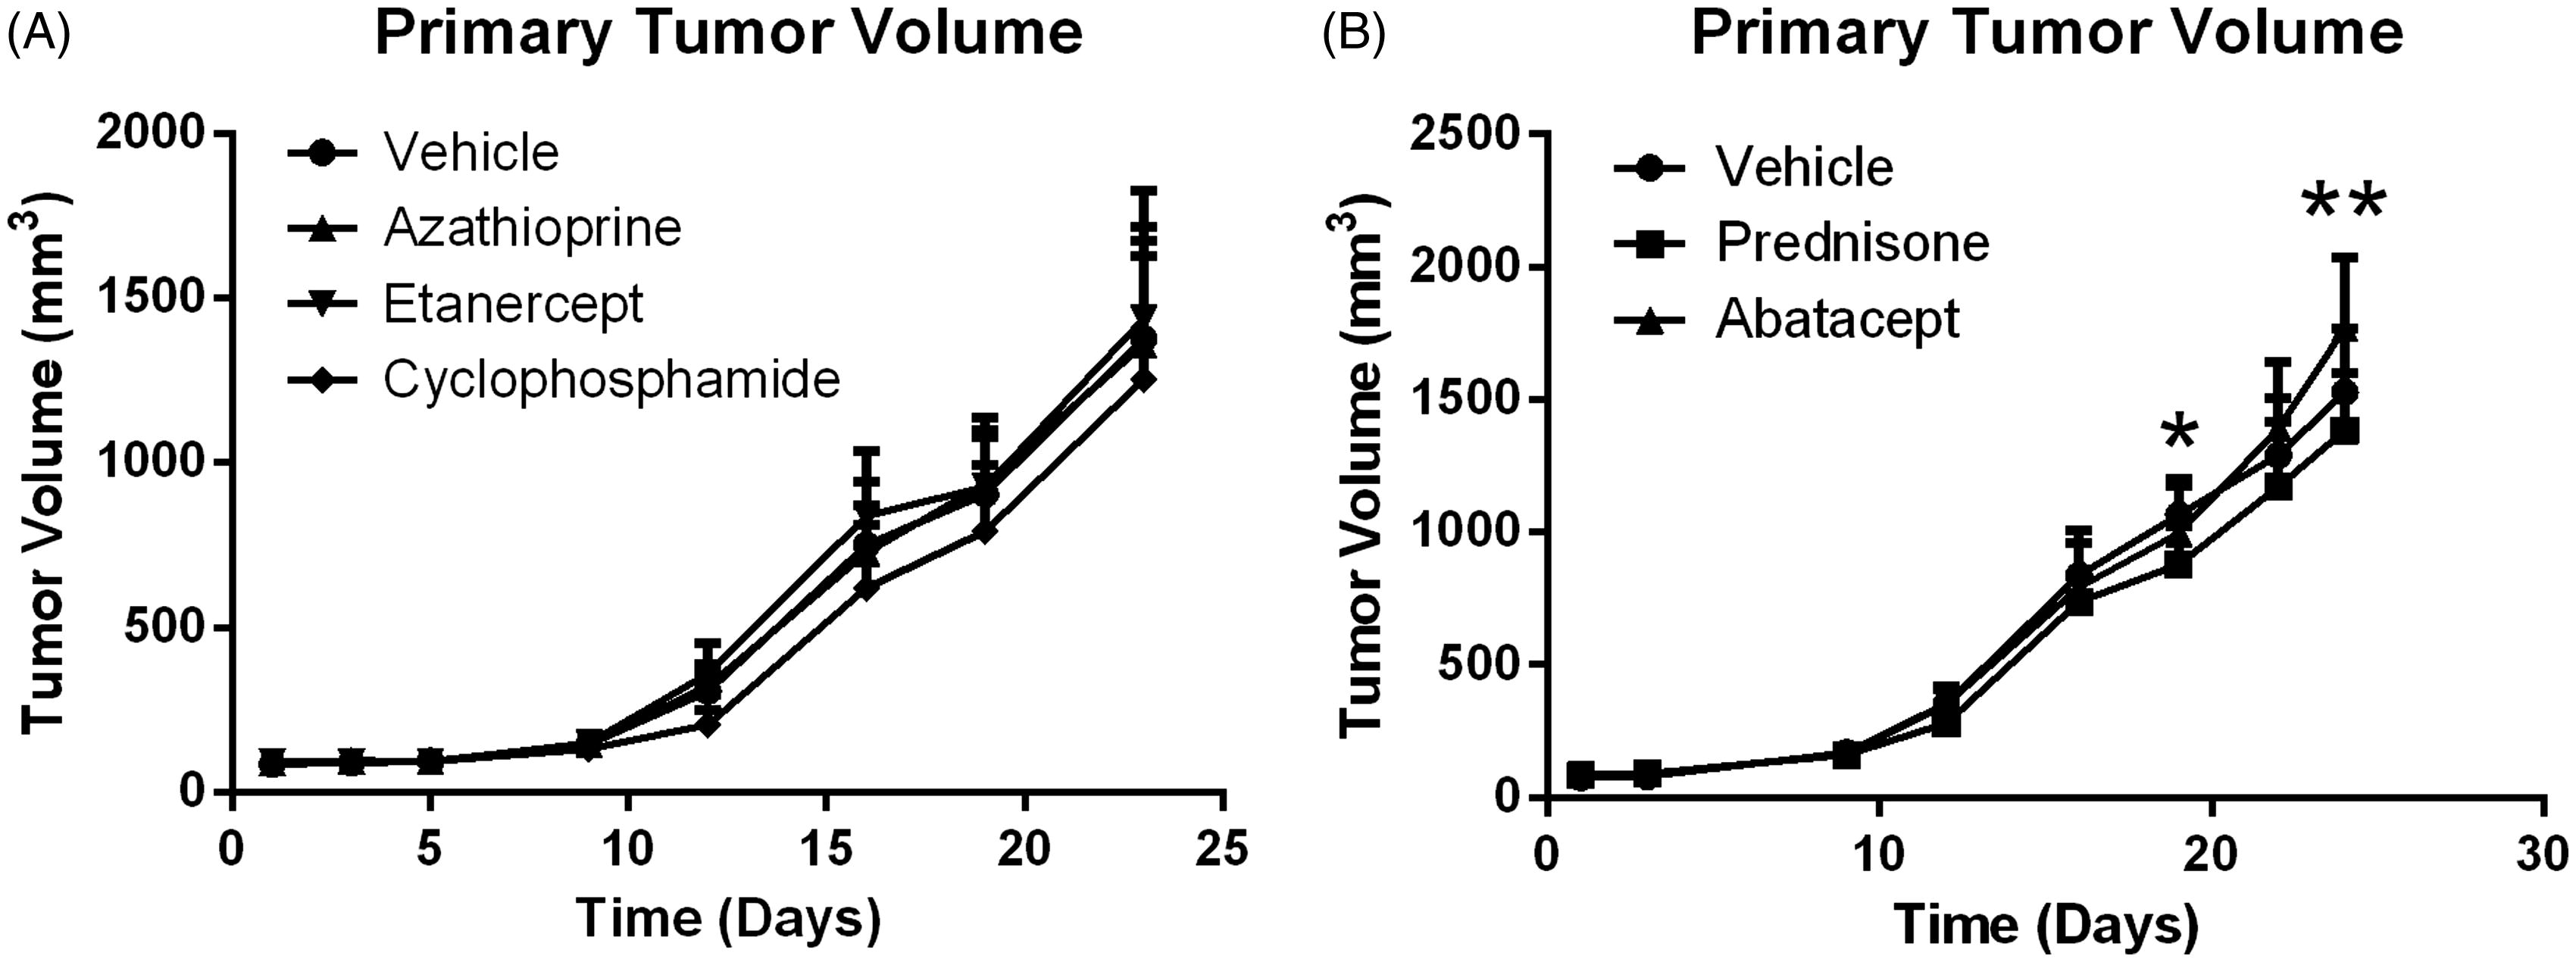
Figure 3. Fluorescence traffic to popliteal lymph node. Abatacept and Prednisone decrease fluorescence traffic to the popliteal lymph nodes, while Azathioprine, Etanercept and CTX have no effect on traffic. Line at mean ± SD is shown. *Significantly less than vehicle control (p < 0.05); n = 12/group. Treatment group always compared to respective control. Red lymph nodes are positive for growth (histological assessment).
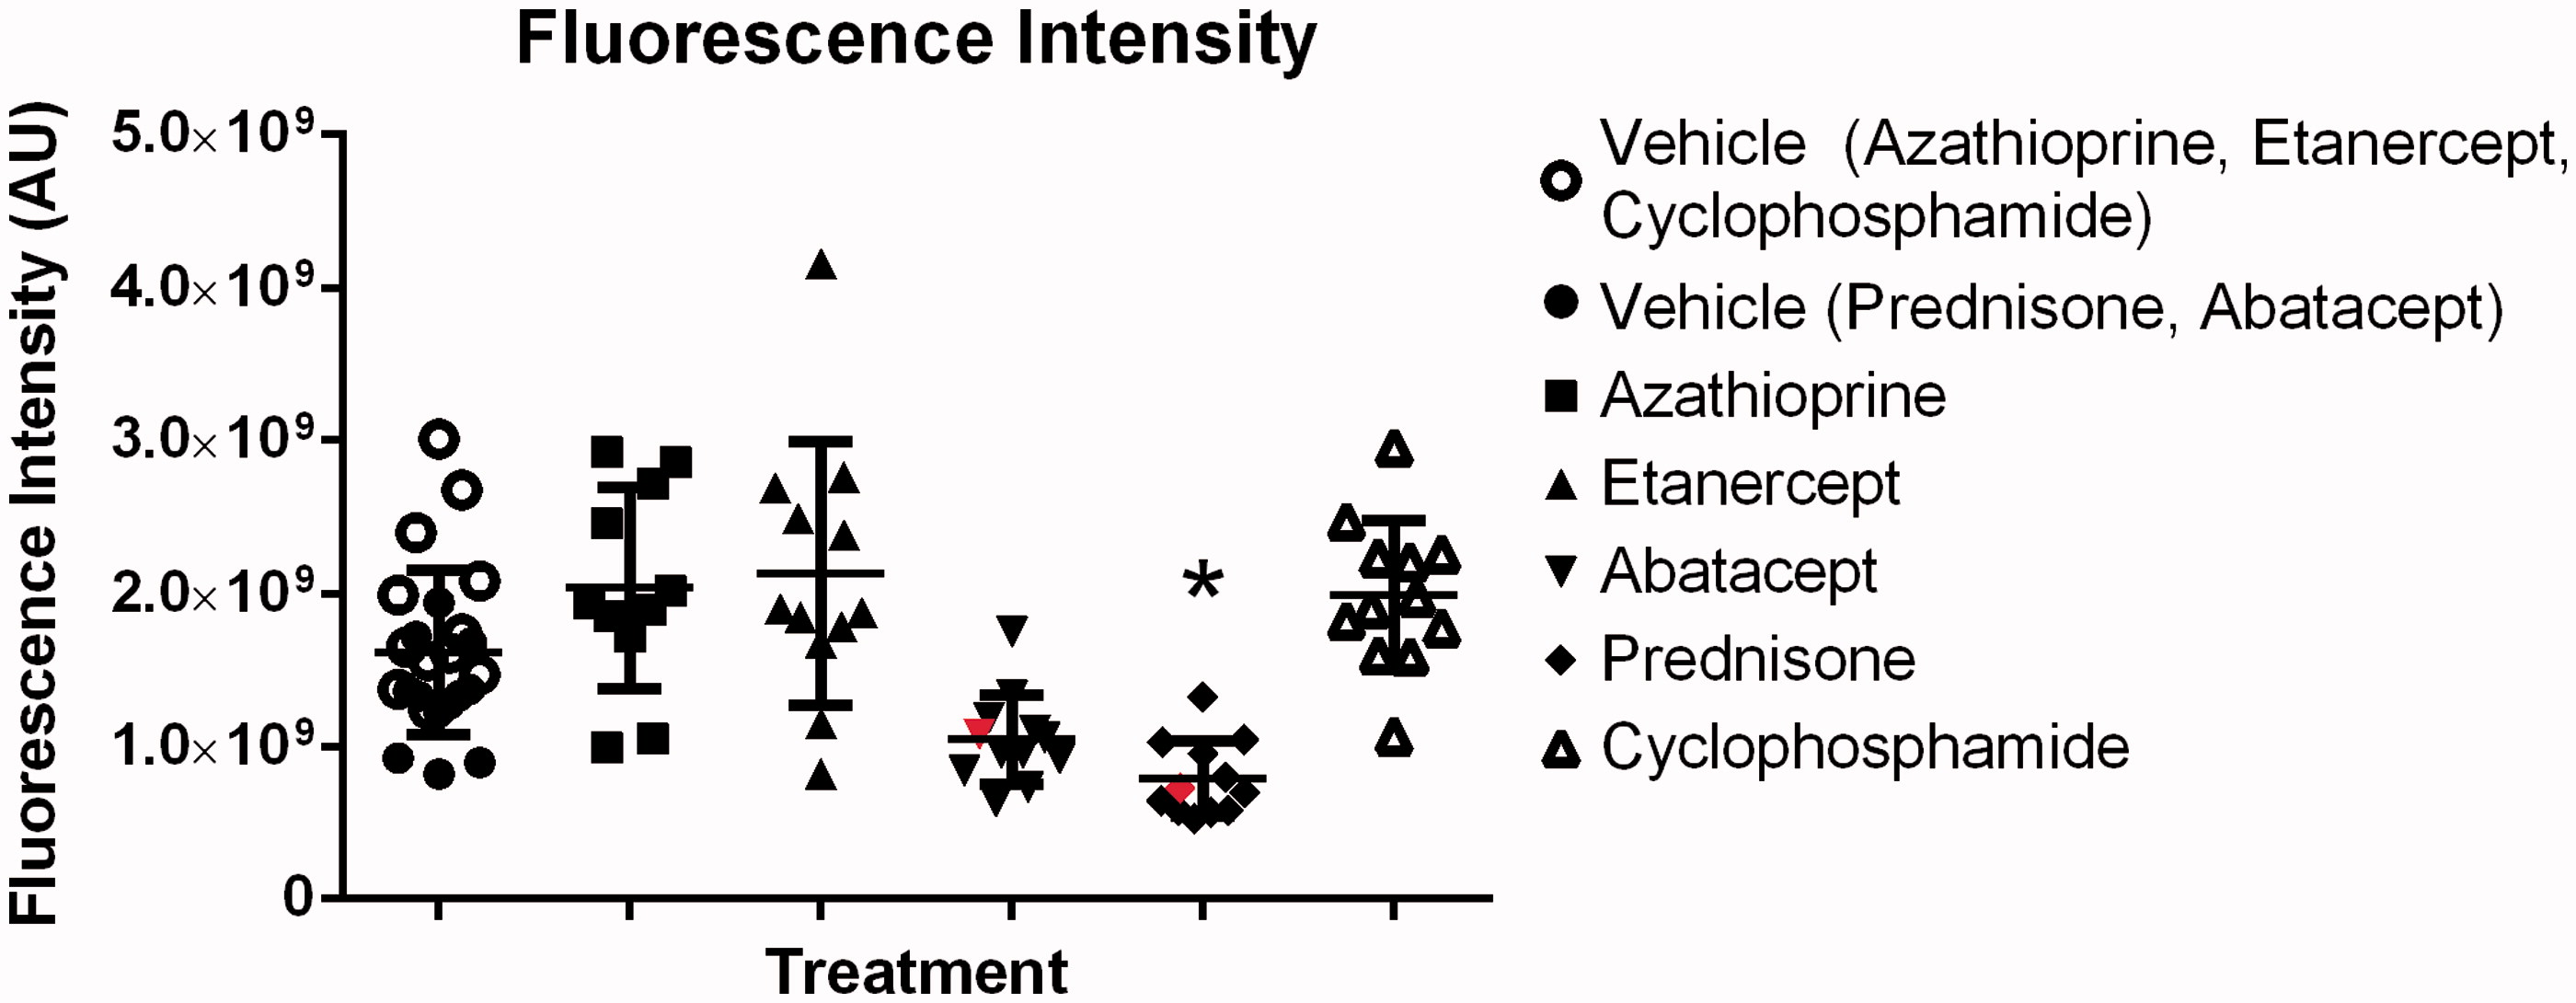
Figure 4. Experimental metastases. CTX increases experimental metastases. Line at median. *Significantly less than vehicle control (p < 0.05); n = 12/group. Treatment group always compared back to respective control.
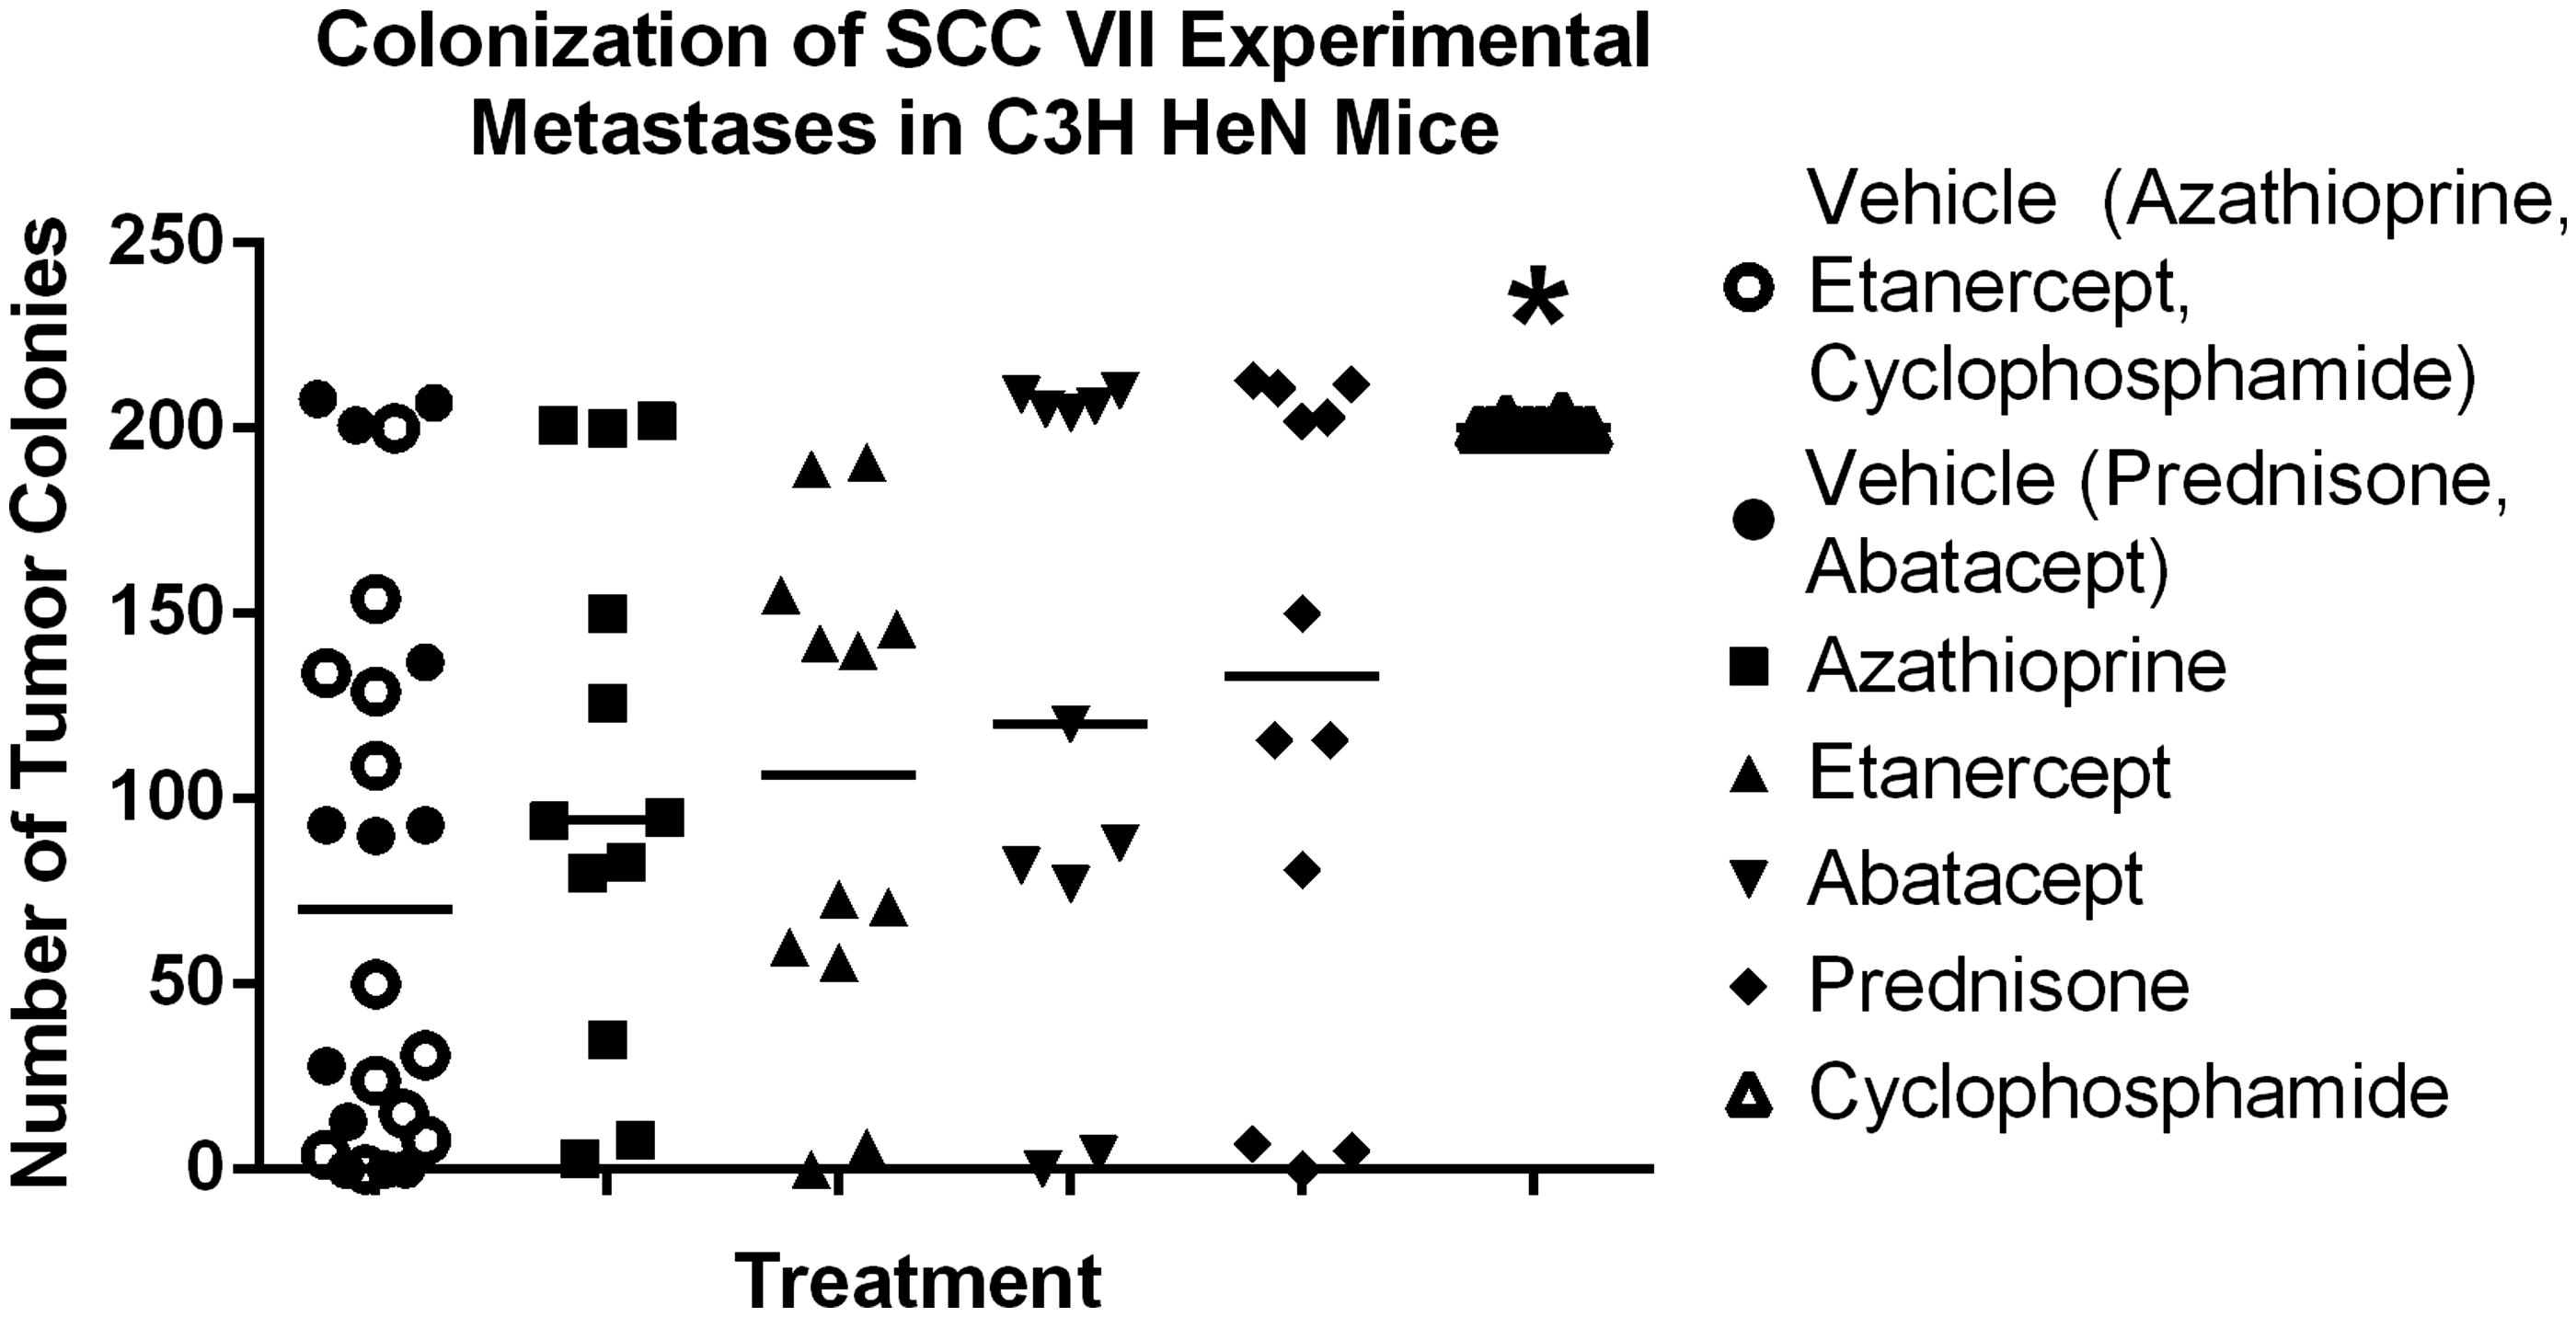
Figure 5. Representative IHC images of SCC VII cells in lung, (a) IHC for BrdU, (b) IHC for vWF. 20X Magnification.
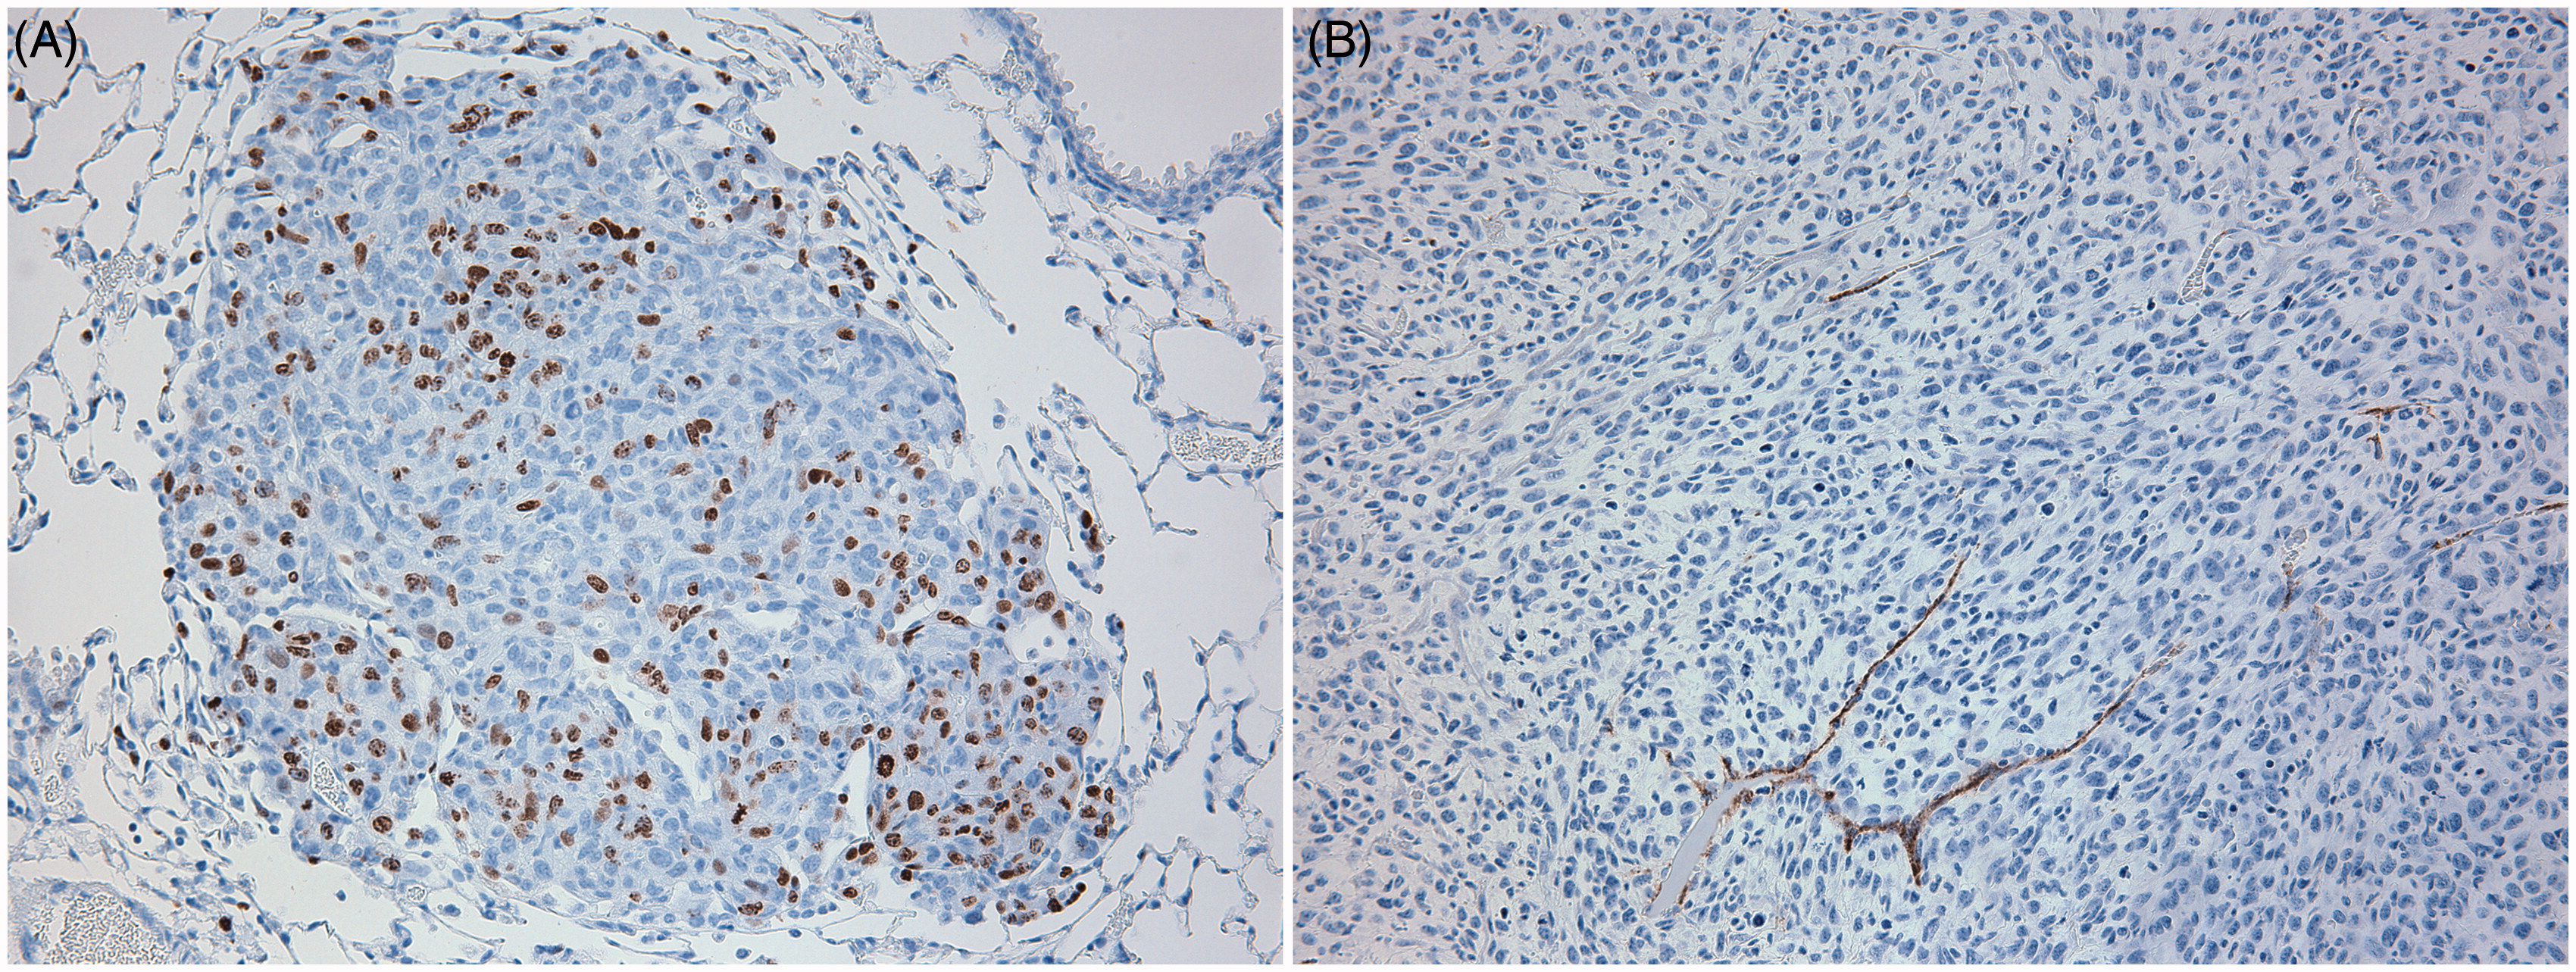
Figure 6. Lesion area for established lung colonies. Abatacept decreases lesion area in established lung colonies. Box and whiskers, Min to Max. *Significantly different from control (p < 0.05); n = 12/group. Treatment group always compared back to respective control.
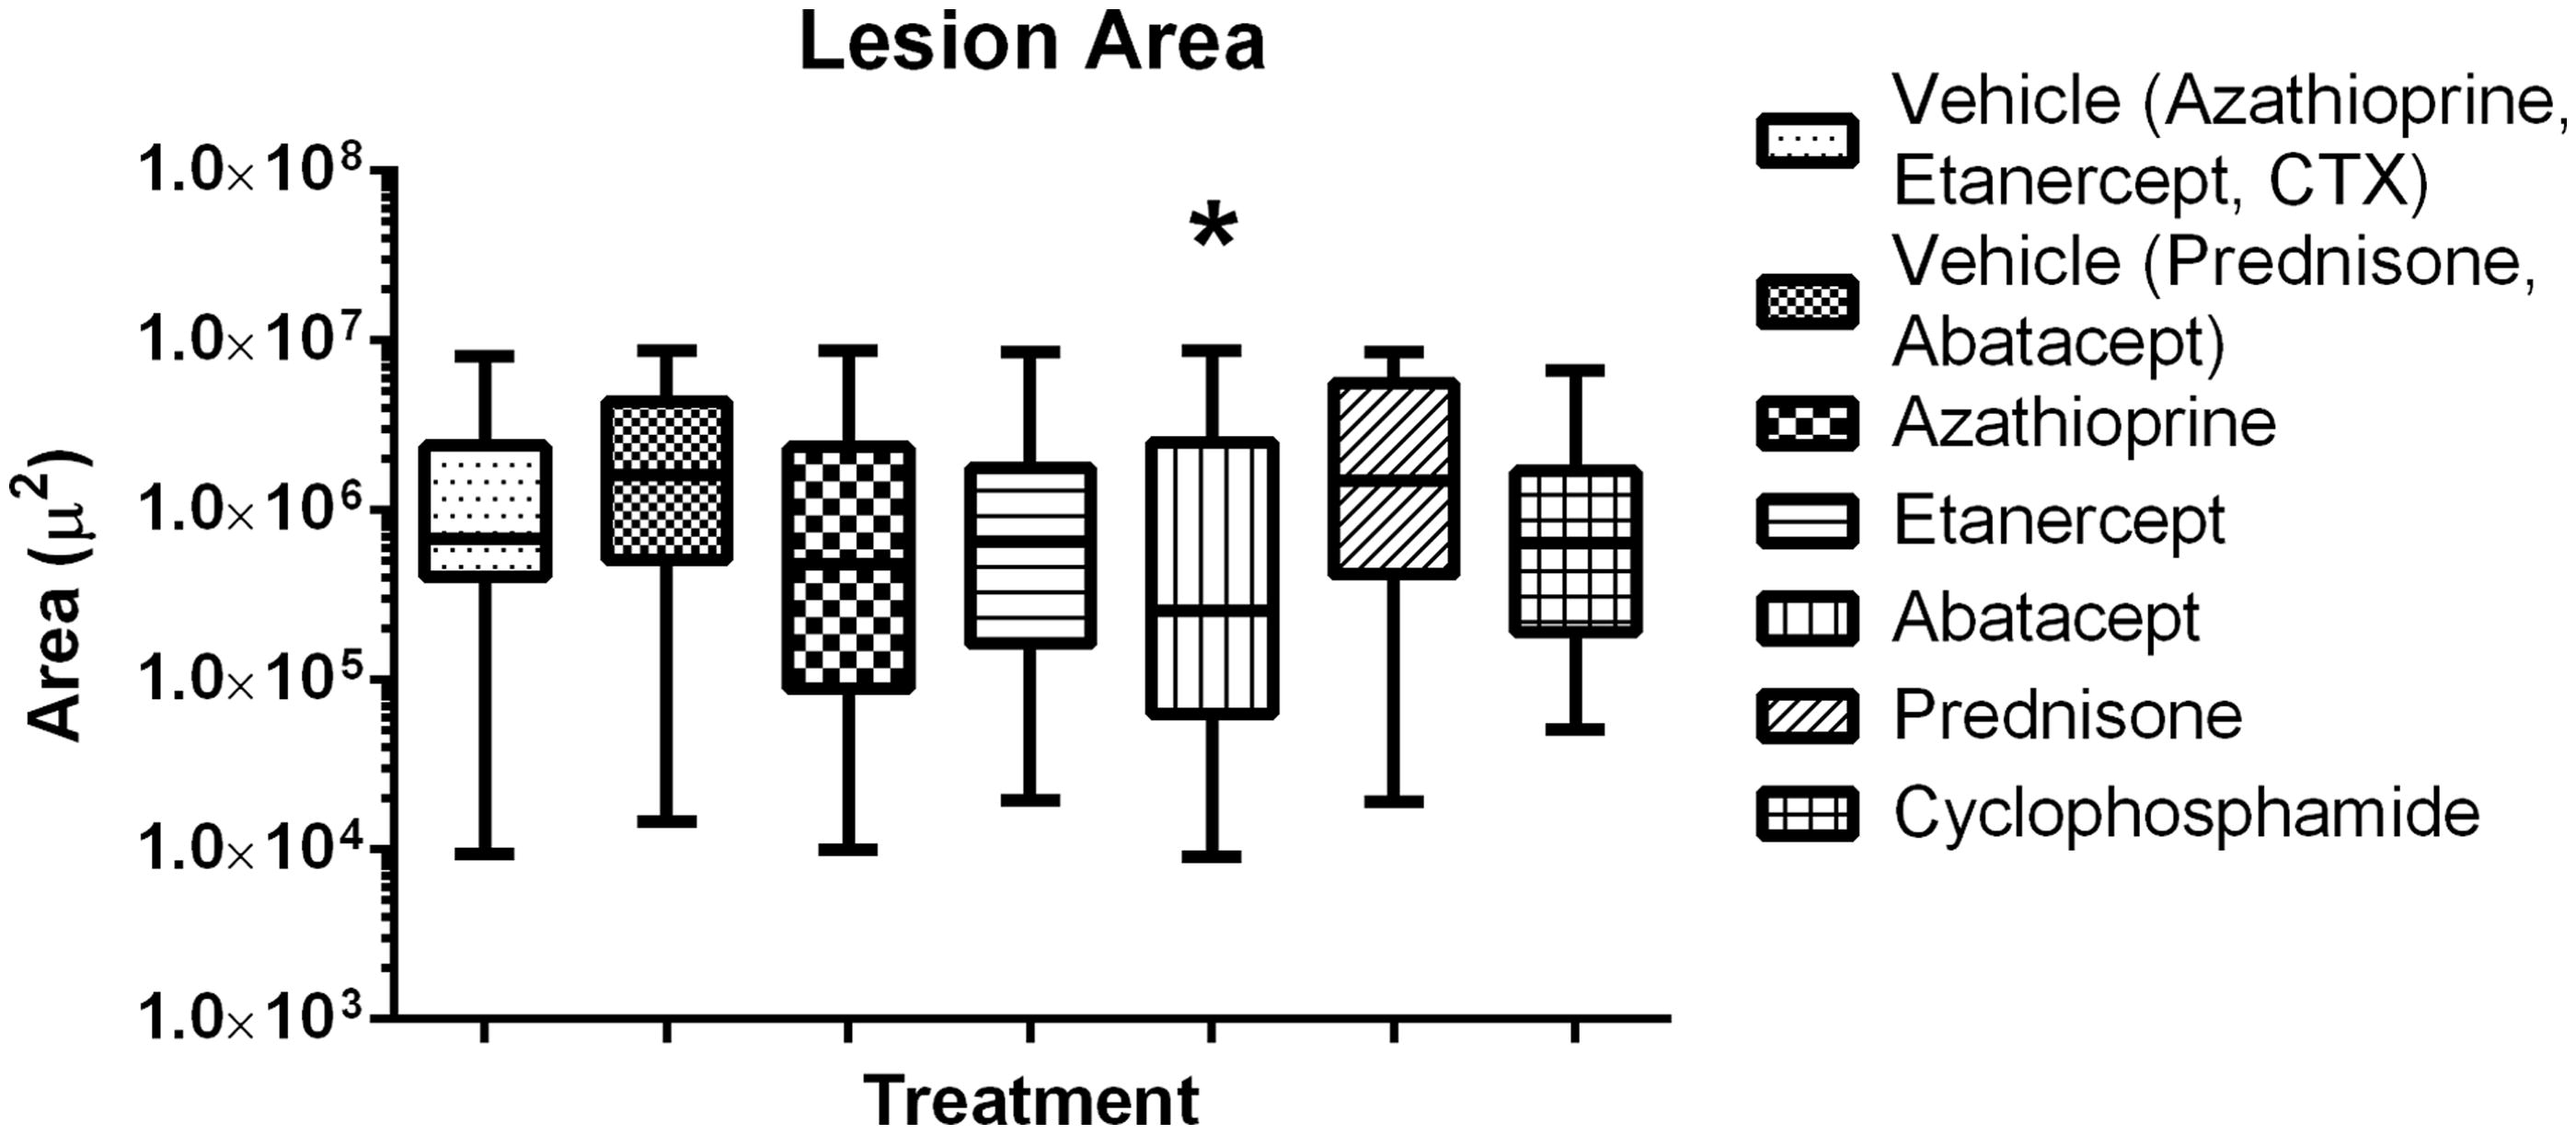
Figure 7. Growth fraction in established colonies. CTX and Azathioprine increase growth fraction in established colonies. Box and whiskers, Min to Max. *Significantly different from control (p < 0.05); n = 12/group. Treatment group always compared back to respective control.
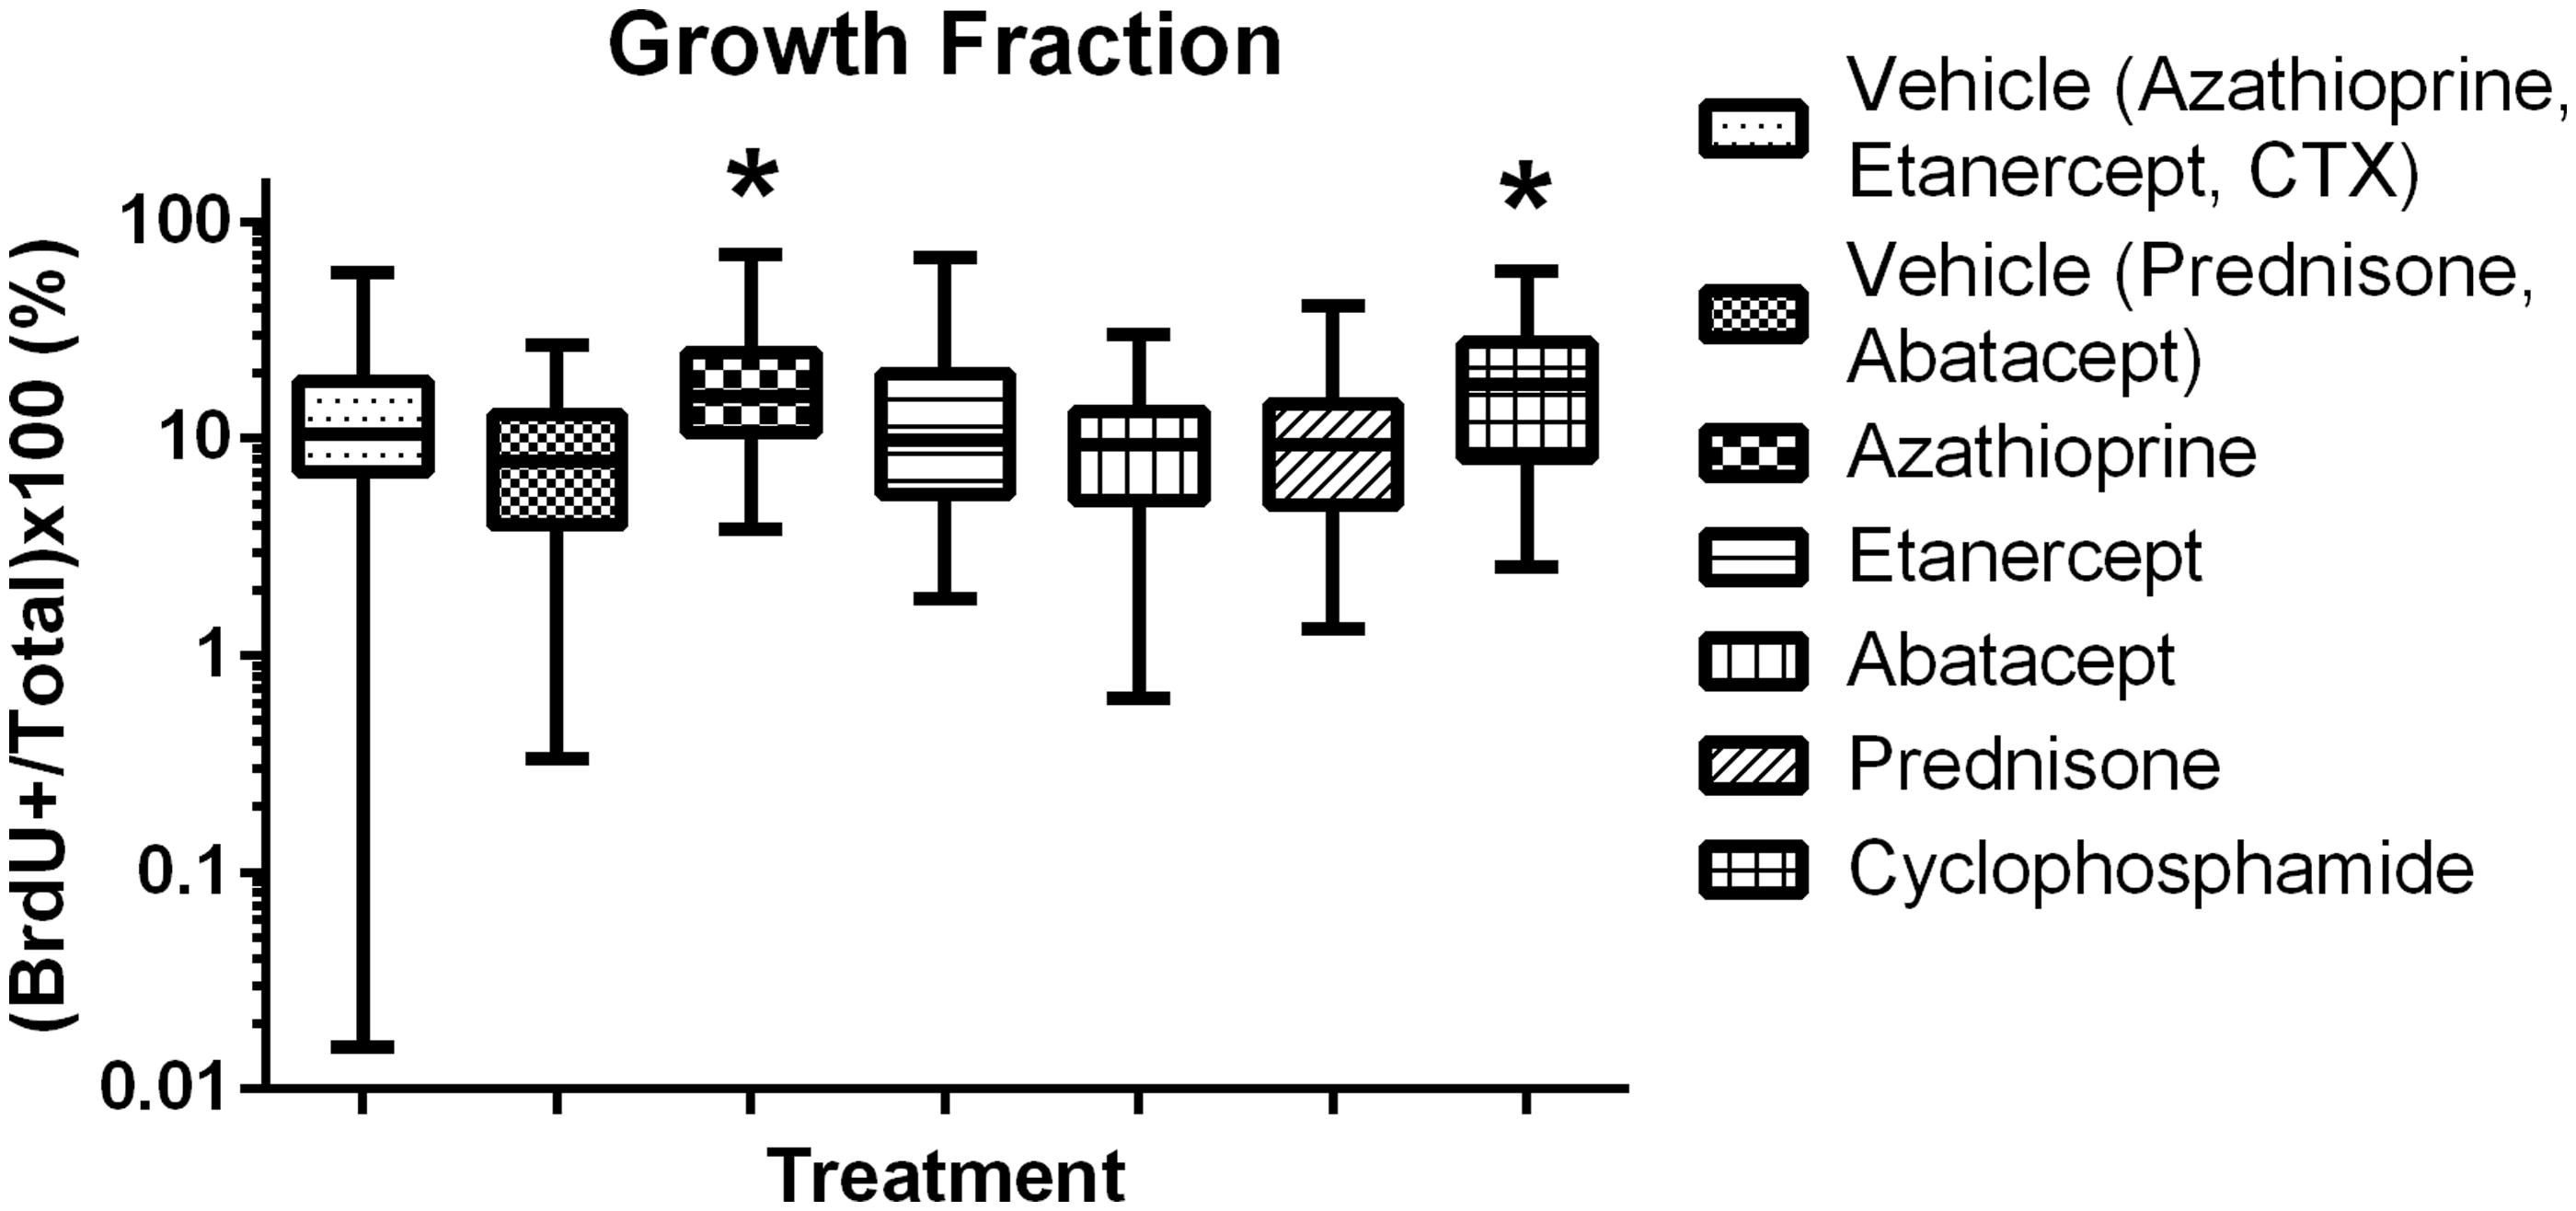
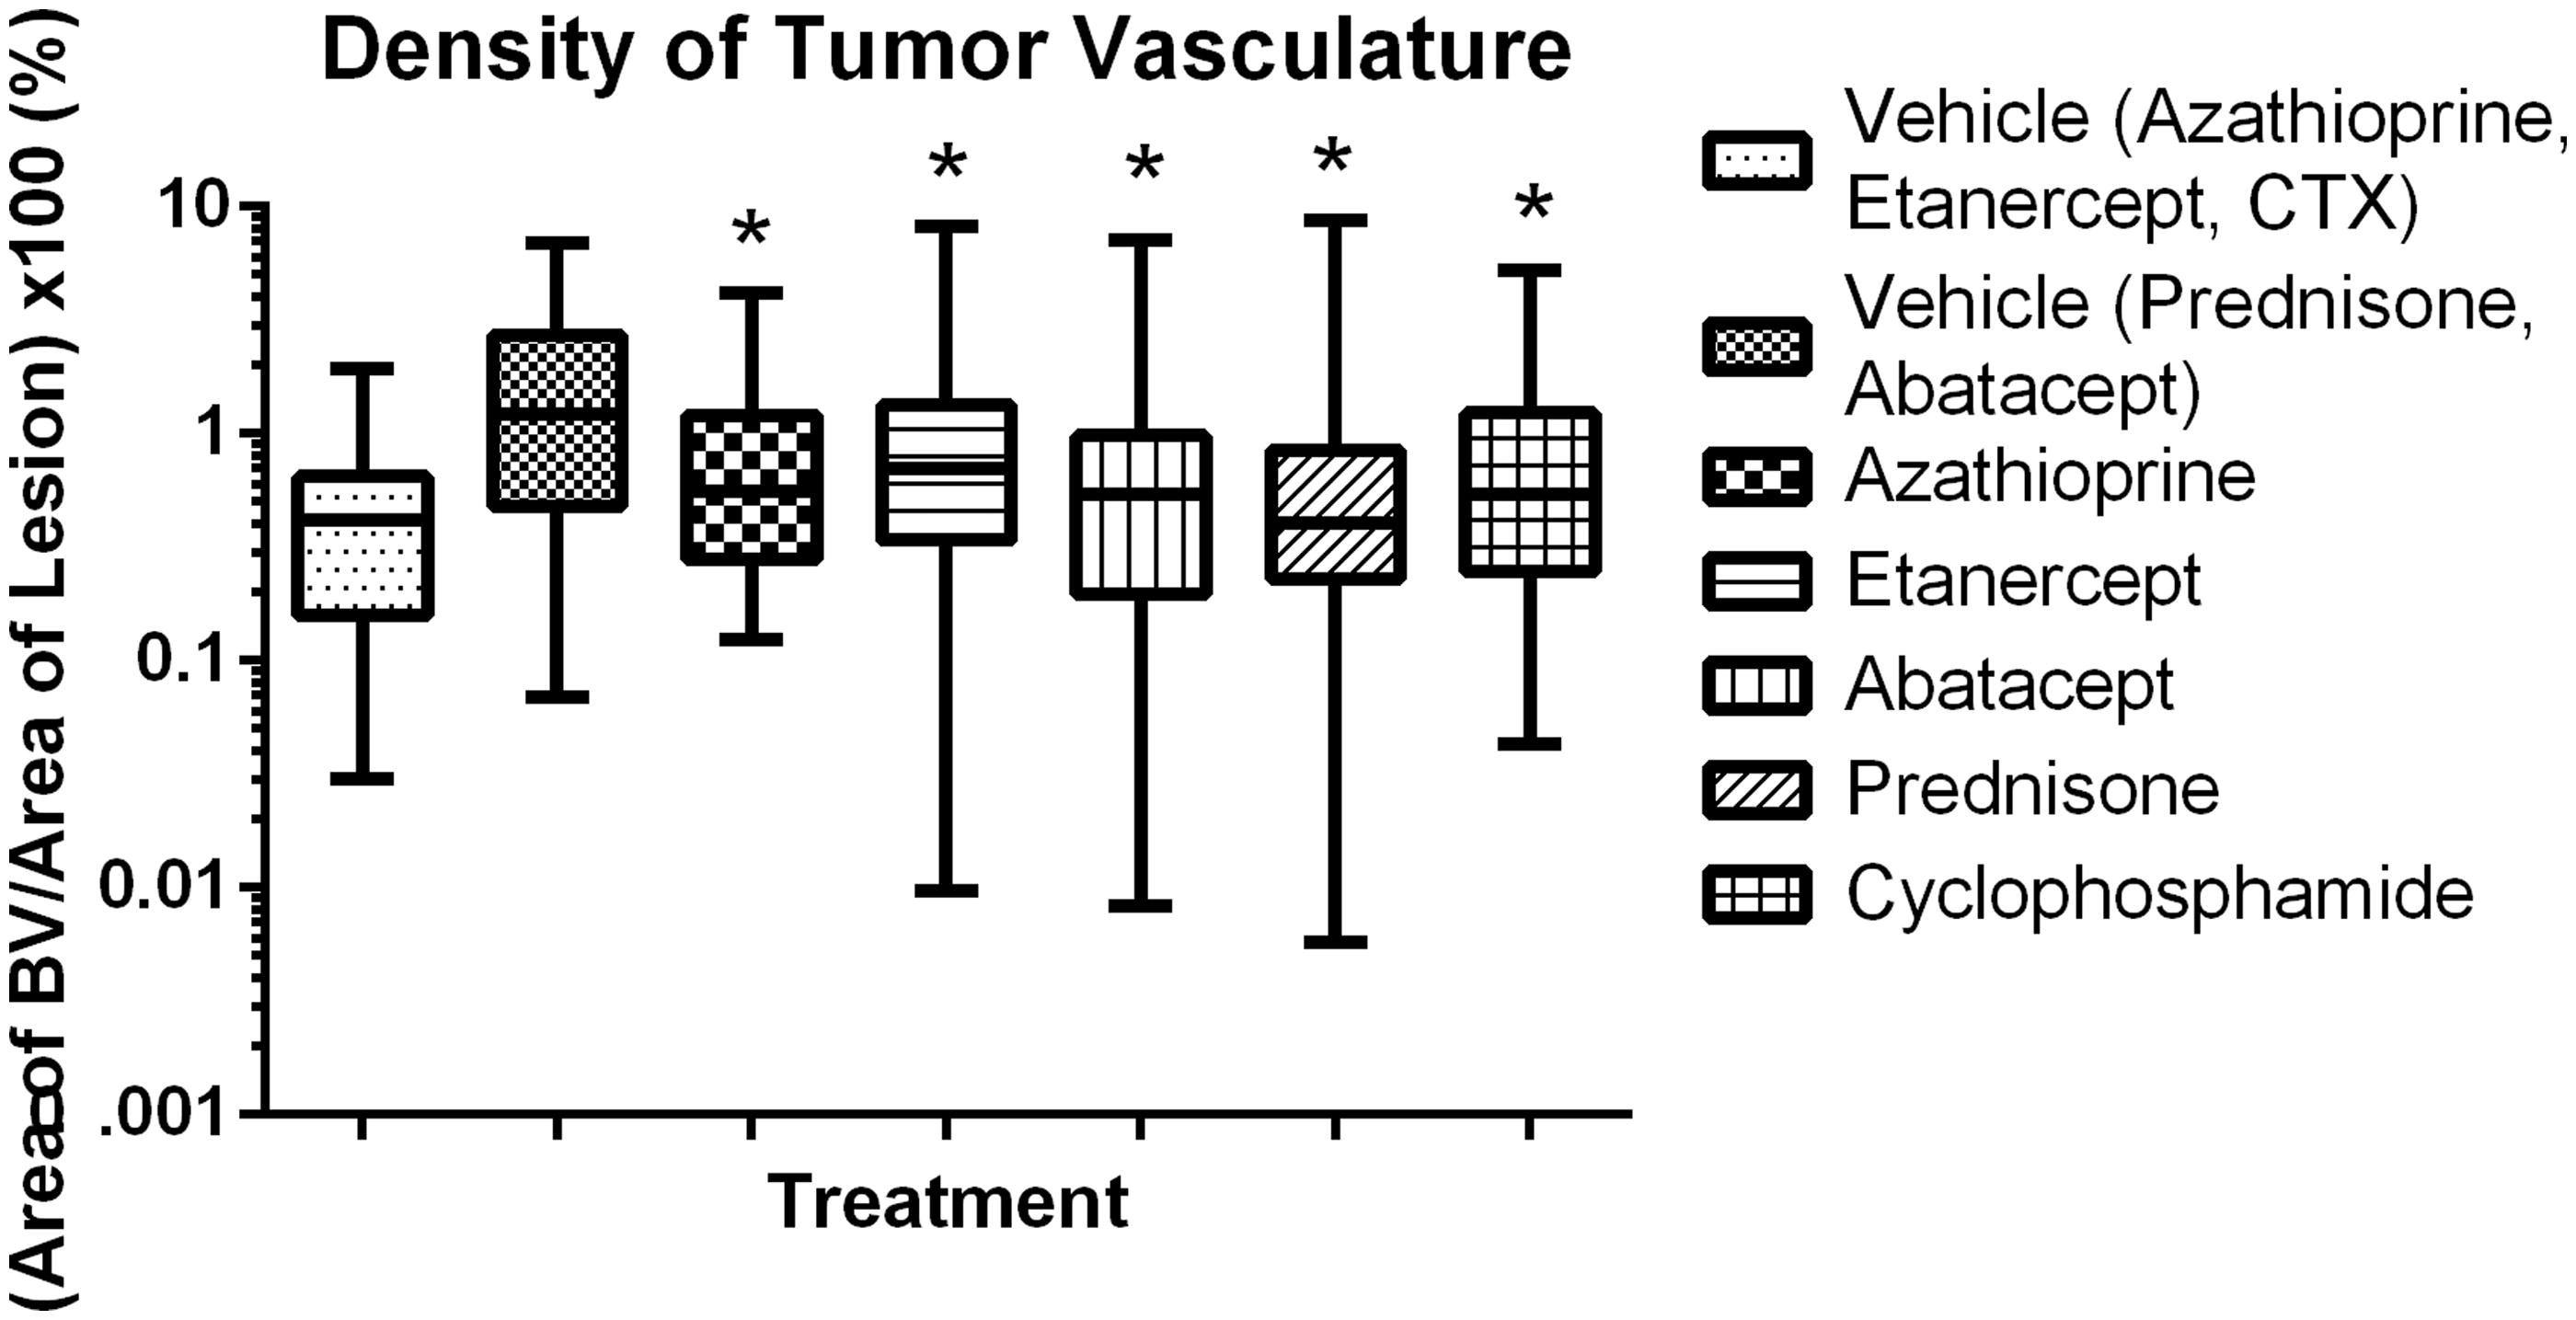
Figure 8. Immunosuppressive drug effects on angiogenesis in established lung colonies. Box and whiskers, Min to Max. *Significantly different from control (p < 0.05); n = 12/group. Treatment group always compared back to respective control.