Figures & data
Figure 1. Porous chitosan-collagen scaffold structure. (a) SEM photograph. (b) Cultured DC integration into scaffold pores (under light microscope; 40× magnification).
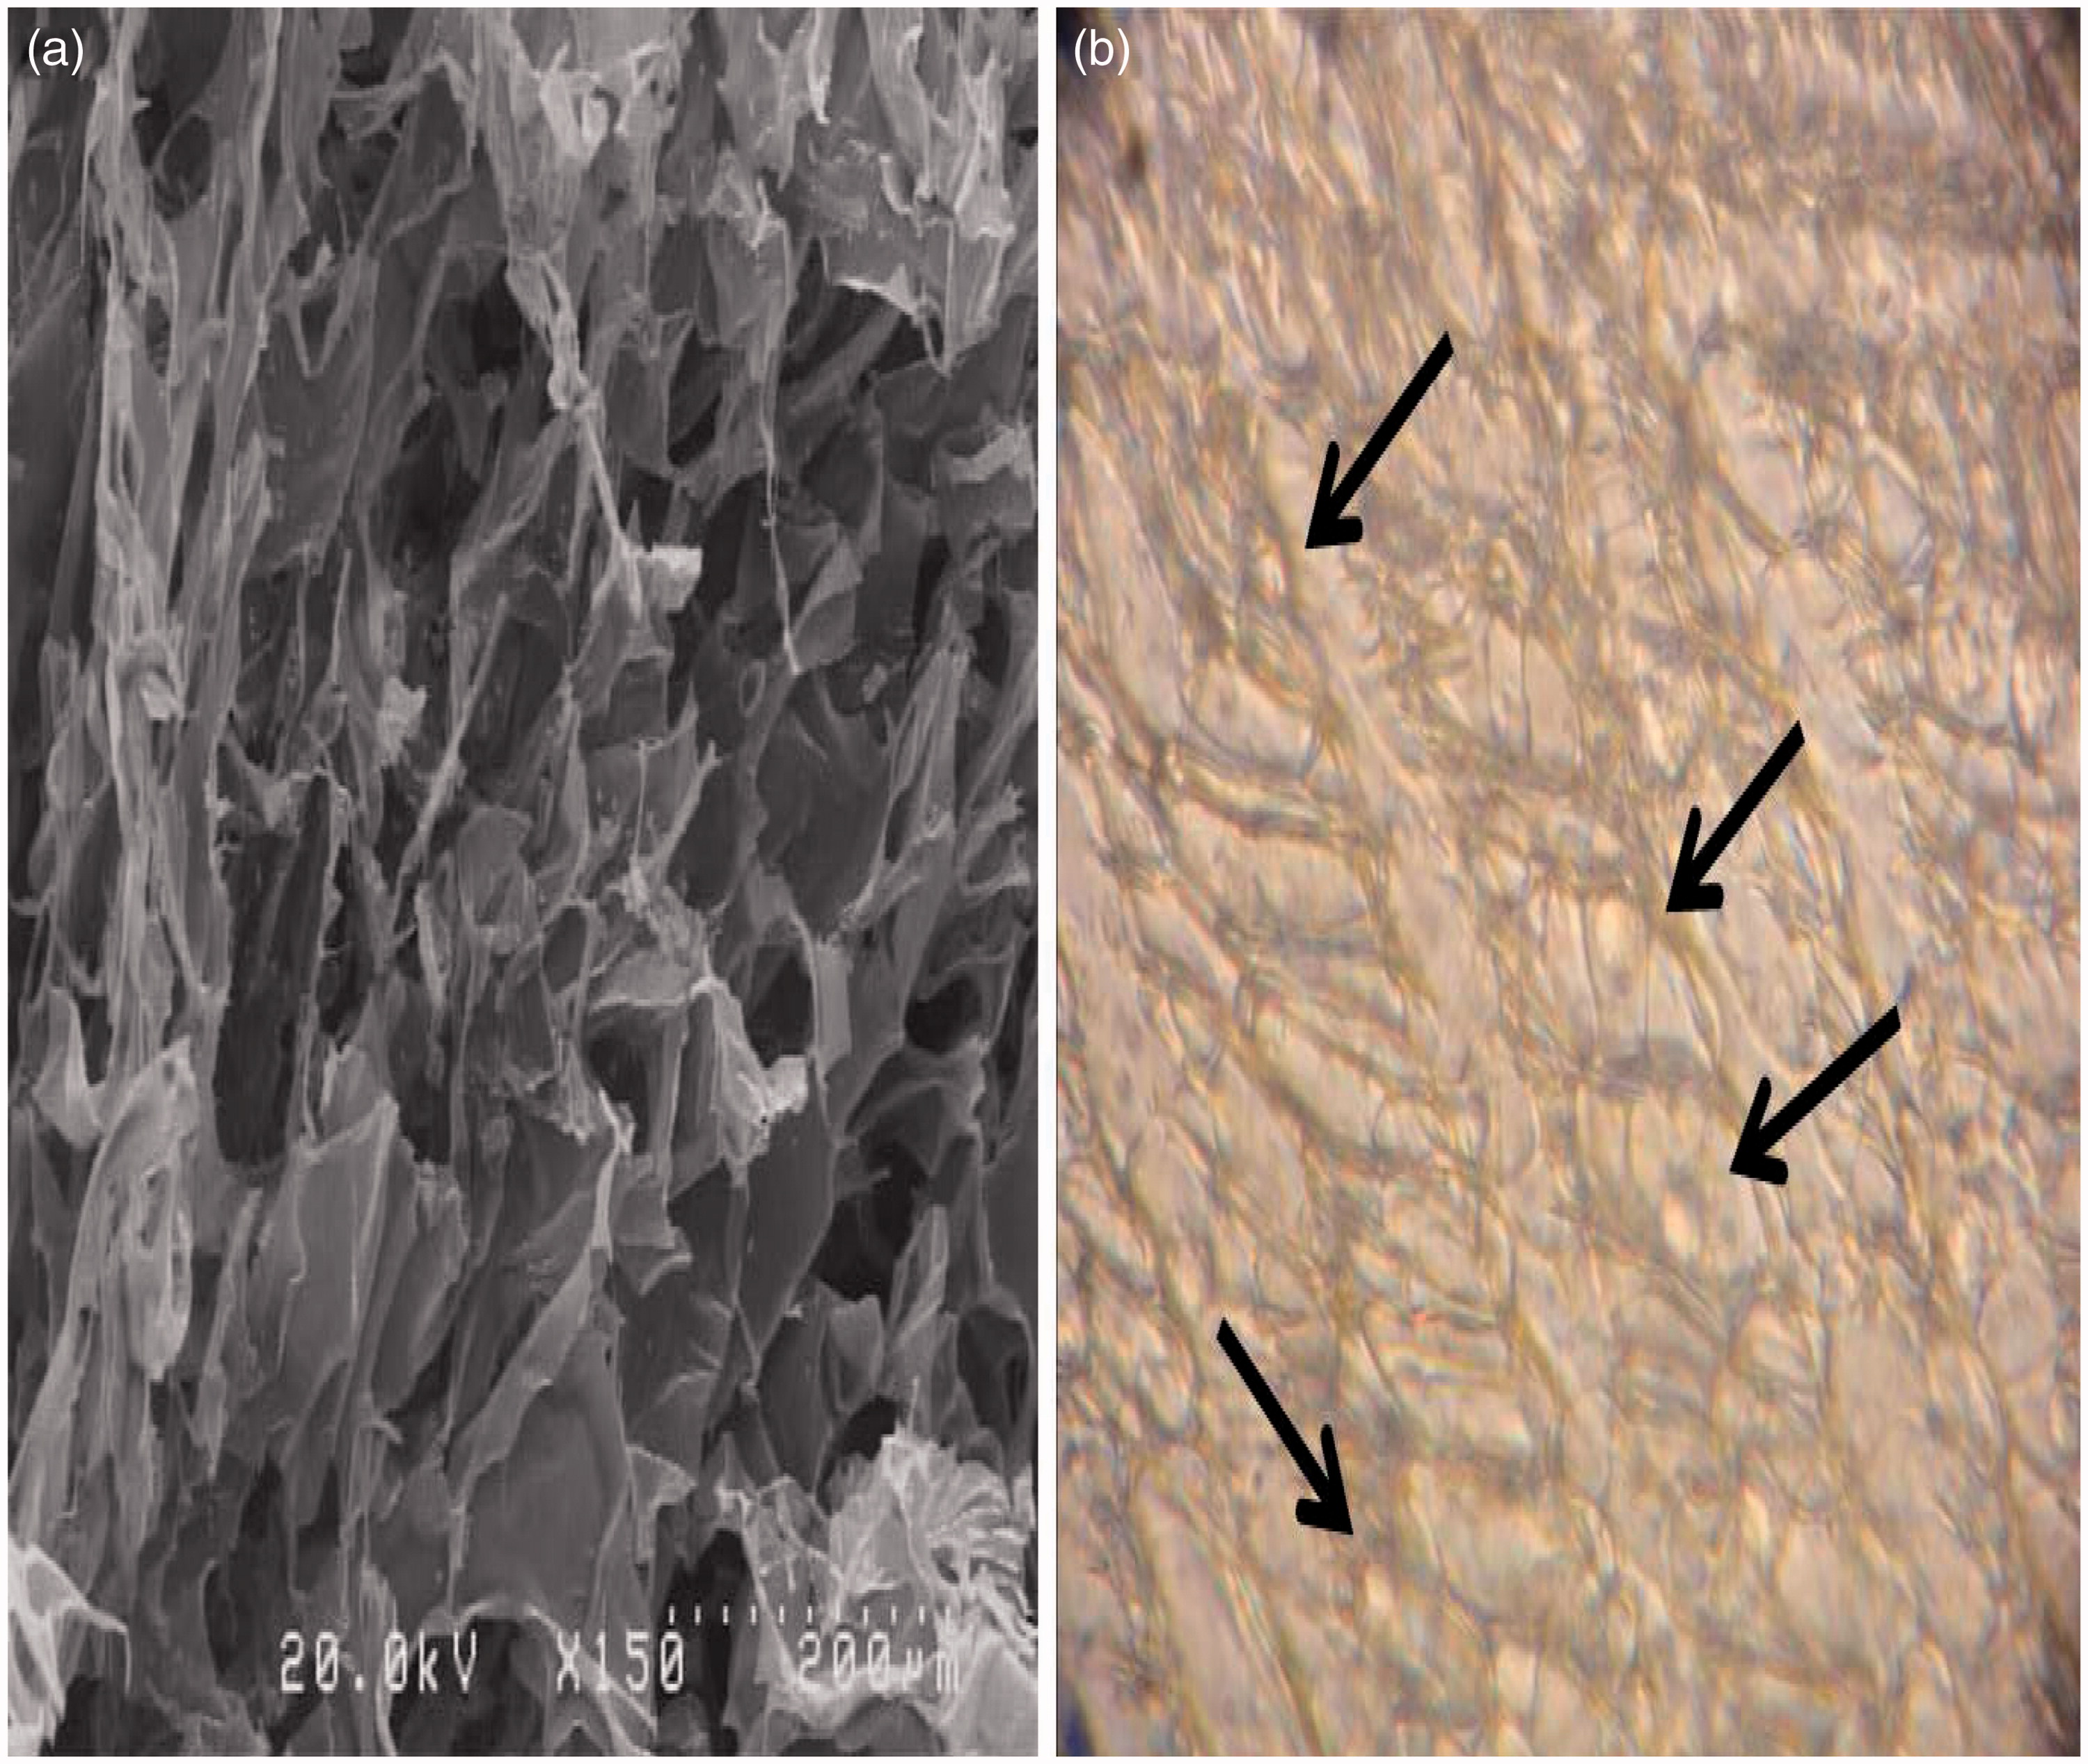
Figure 2. SEM demonstration of DNA-chitosan nanoparticles (NP), DC nanoparticle uptake and DC viability (as relative viability, i.e. viability of treated DC/untreated DC). (a and b) After 6 h exposure with FITC-labeled siRNA-chirosan NP, >80% of DC had taken up the NP and expressed green light. (c) SEM analysis of aggregates (due to drying of materials for SEM) of the NP that each had uniform spherical forms (45–50 nm diameters). (d) DC viability was approximately the same in different groups as well as within and between the two culture systems (2D [plate] vs 3D [scaffold]).
![Figure 2. SEM demonstration of DNA-chitosan nanoparticles (NP), DC nanoparticle uptake and DC viability (as relative viability, i.e. viability of treated DC/untreated DC). (a and b) After 6 h exposure with FITC-labeled siRNA-chirosan NP, >80% of DC had taken up the NP and expressed green light. (c) SEM analysis of aggregates (due to drying of materials for SEM) of the NP that each had uniform spherical forms (45–50 nm diameters). (d) DC viability was approximately the same in different groups as well as within and between the two culture systems (2D [plate] vs 3D [scaffold]).](/cms/asset/3180ed90-55a6-4e3e-8c37-cf02dd4ba94c/iimt_a_1045636_f0002_c.jpg)
Figure 3. Flow cytometric analysis of cultured DC maturation marker expression. Expression of CD40, CD86 and MHC II on cells maintained on 3D chitosan scaffolds (scaff) were accelerated in comparison to on cells maintained in 2D culture plates (plate).
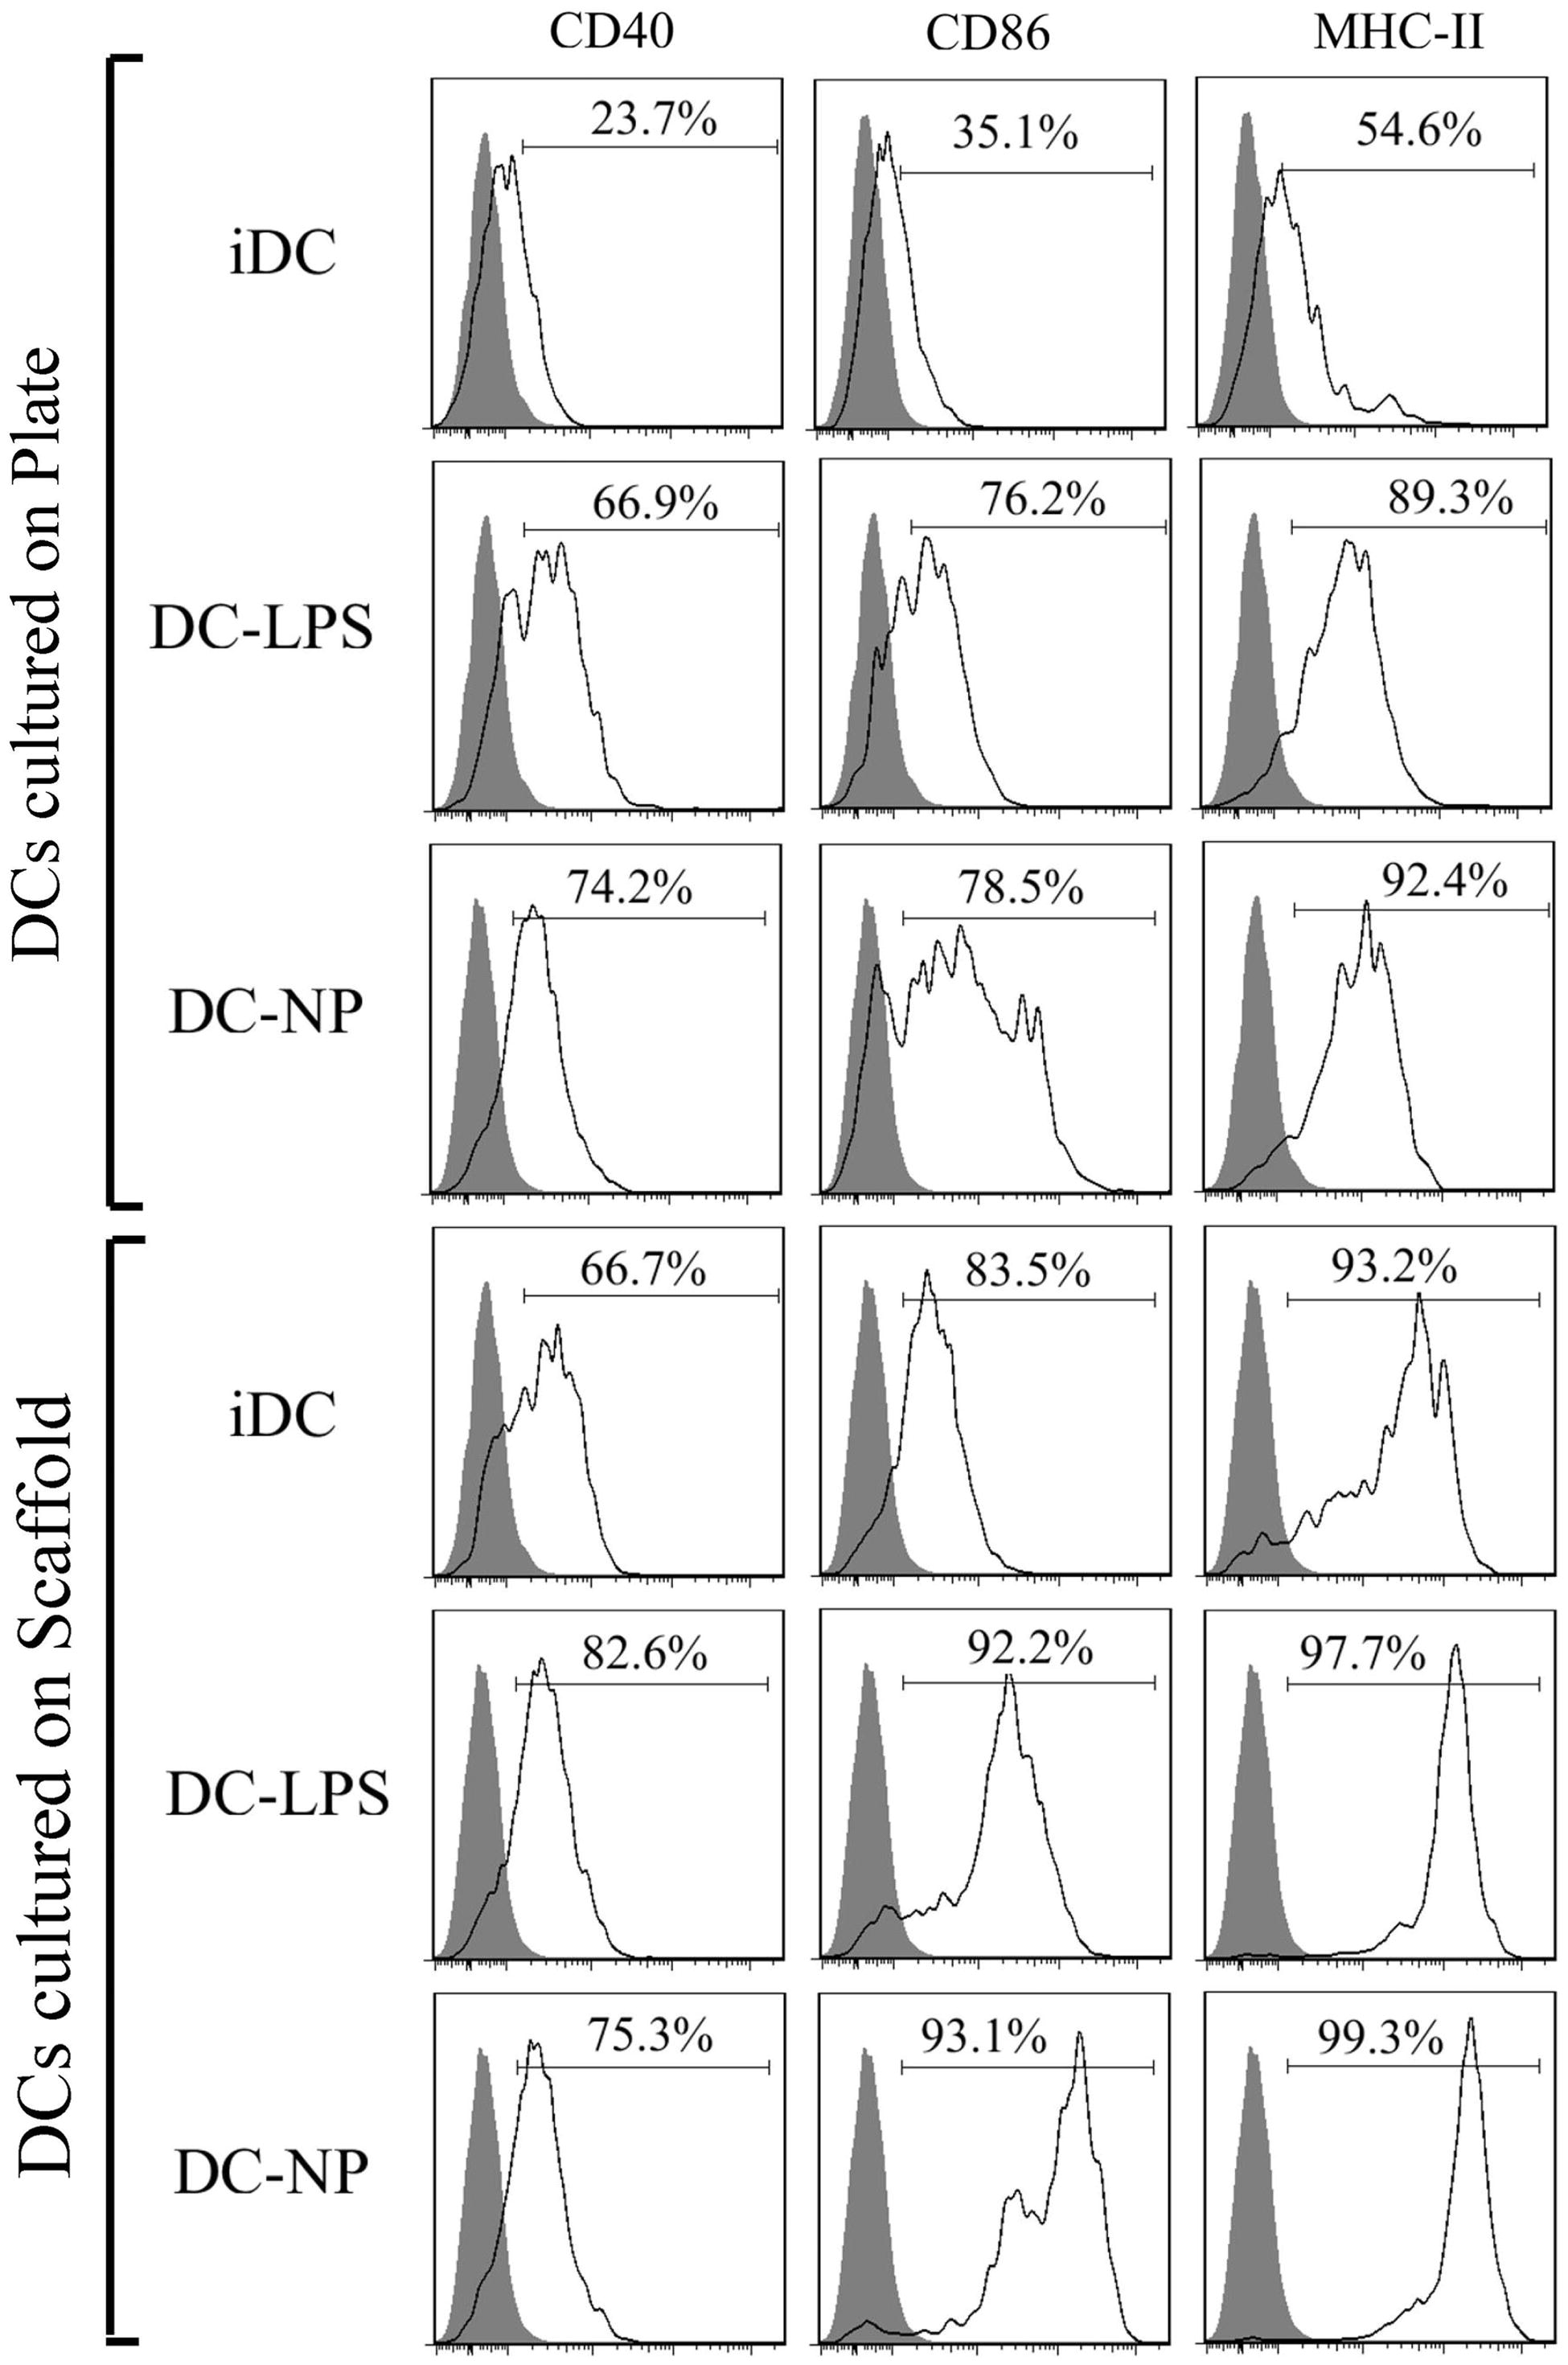
Figure 4. Cytokine release from DC maintained in 2D culture plates (plate) and 3D scaffolds (scaff) systems and treated with LPS or DNA/chitosan NP. (a) TNFα, (b) IL-6, (c) IL-12. *Significant differences between groups are indicated (p < 0.05).
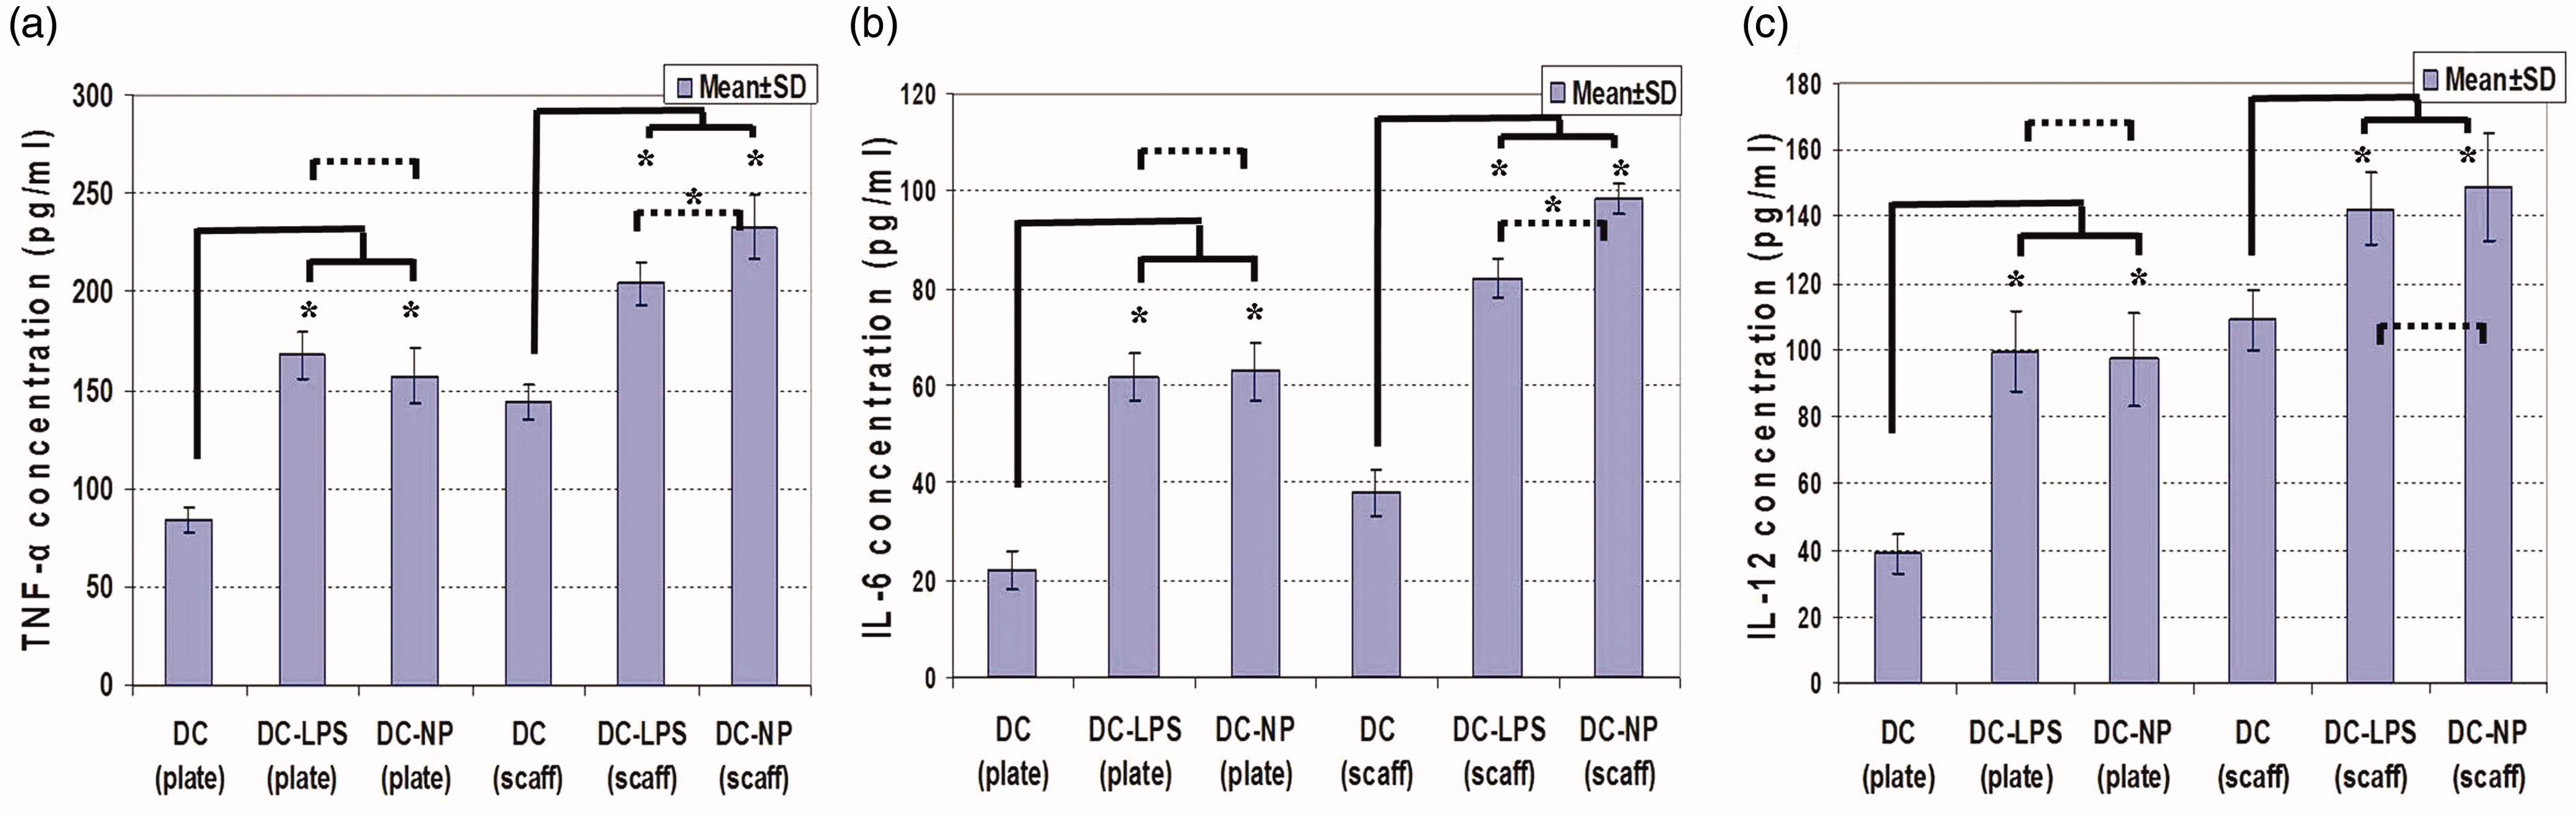
Figure 5. DC-T-lymphocyte interactions: proliferation in a mixed-leukocyte reaction. Representative microscopy images: (a1) DC alone. (a2) DC-T-lymphocyte interactions; starting point. DC-T-lymphocyte interactions in (a3) low- and (a4) high-proliferation fields. (b) T-lymphocyte proliferation in comparison to controls (T-lymphocytes alone; Stimulation Index (SI) = 1.0). Values shown are mean [± SD] SI values in cells maintained in 3D scaffold (scaff) vs 2D culture plates (plate) systems. *Significant differences between groups are indicated (p < 0.05).
![Figure 5. DC-T-lymphocyte interactions: proliferation in a mixed-leukocyte reaction. Representative microscopy images: (a1) DC alone. (a2) DC-T-lymphocyte interactions; starting point. DC-T-lymphocyte interactions in (a3) low- and (a4) high-proliferation fields. (b) T-lymphocyte proliferation in comparison to controls (T-lymphocytes alone; Stimulation Index (SI) = 1.0). Values shown are mean [± SD] SI values in cells maintained in 3D scaffold (scaff) vs 2D culture plates (plate) systems. *Significant differences between groups are indicated (p < 0.05).](/cms/asset/d30823e5-439b-4575-b8f7-012437c2002c/iimt_a_1045636_f0005_c.jpg)
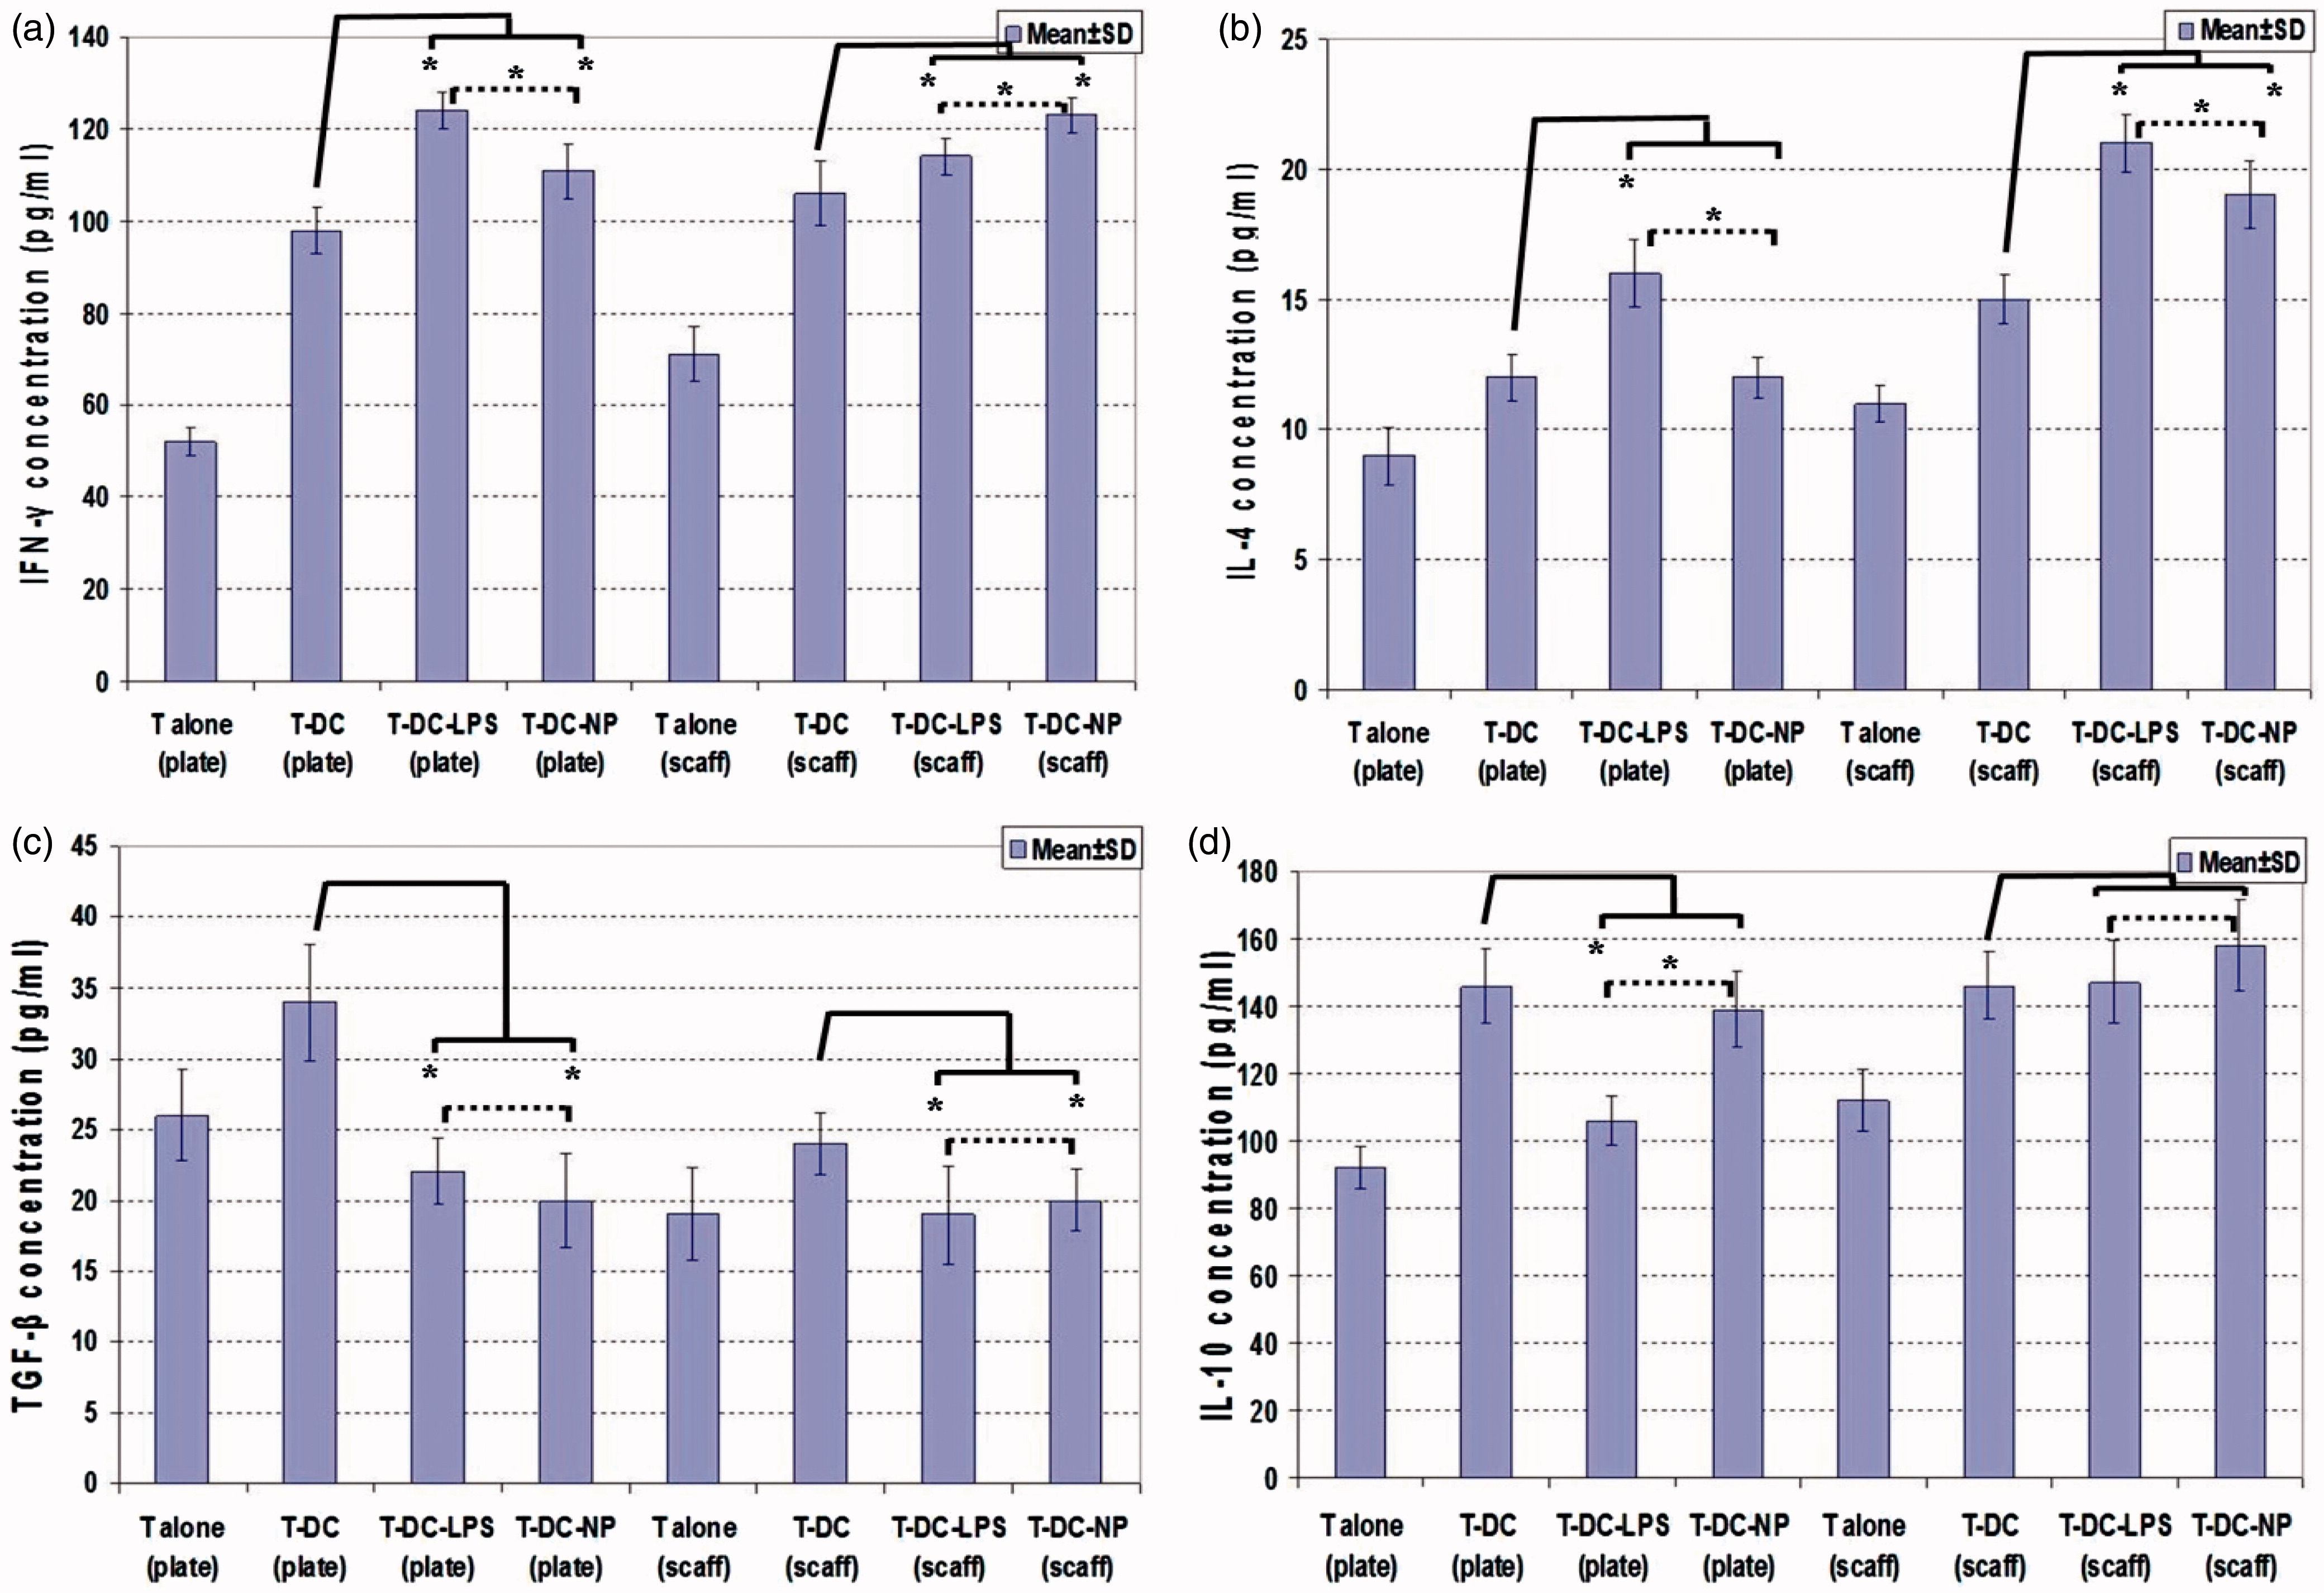
Figure 6. T-Lymphocyte cytokine release during co-cultures with DC in 3D scaffold (scaff) vs 2D culture plates (plate) systems. (a) IFNγ. (b) IL-4. (c) TGFβ. (d) IL-1. *Significant differences between groups are indicated (p < 0.05).