Figures & data
Figure 1. Experimental plan of doses and treatment schedules.
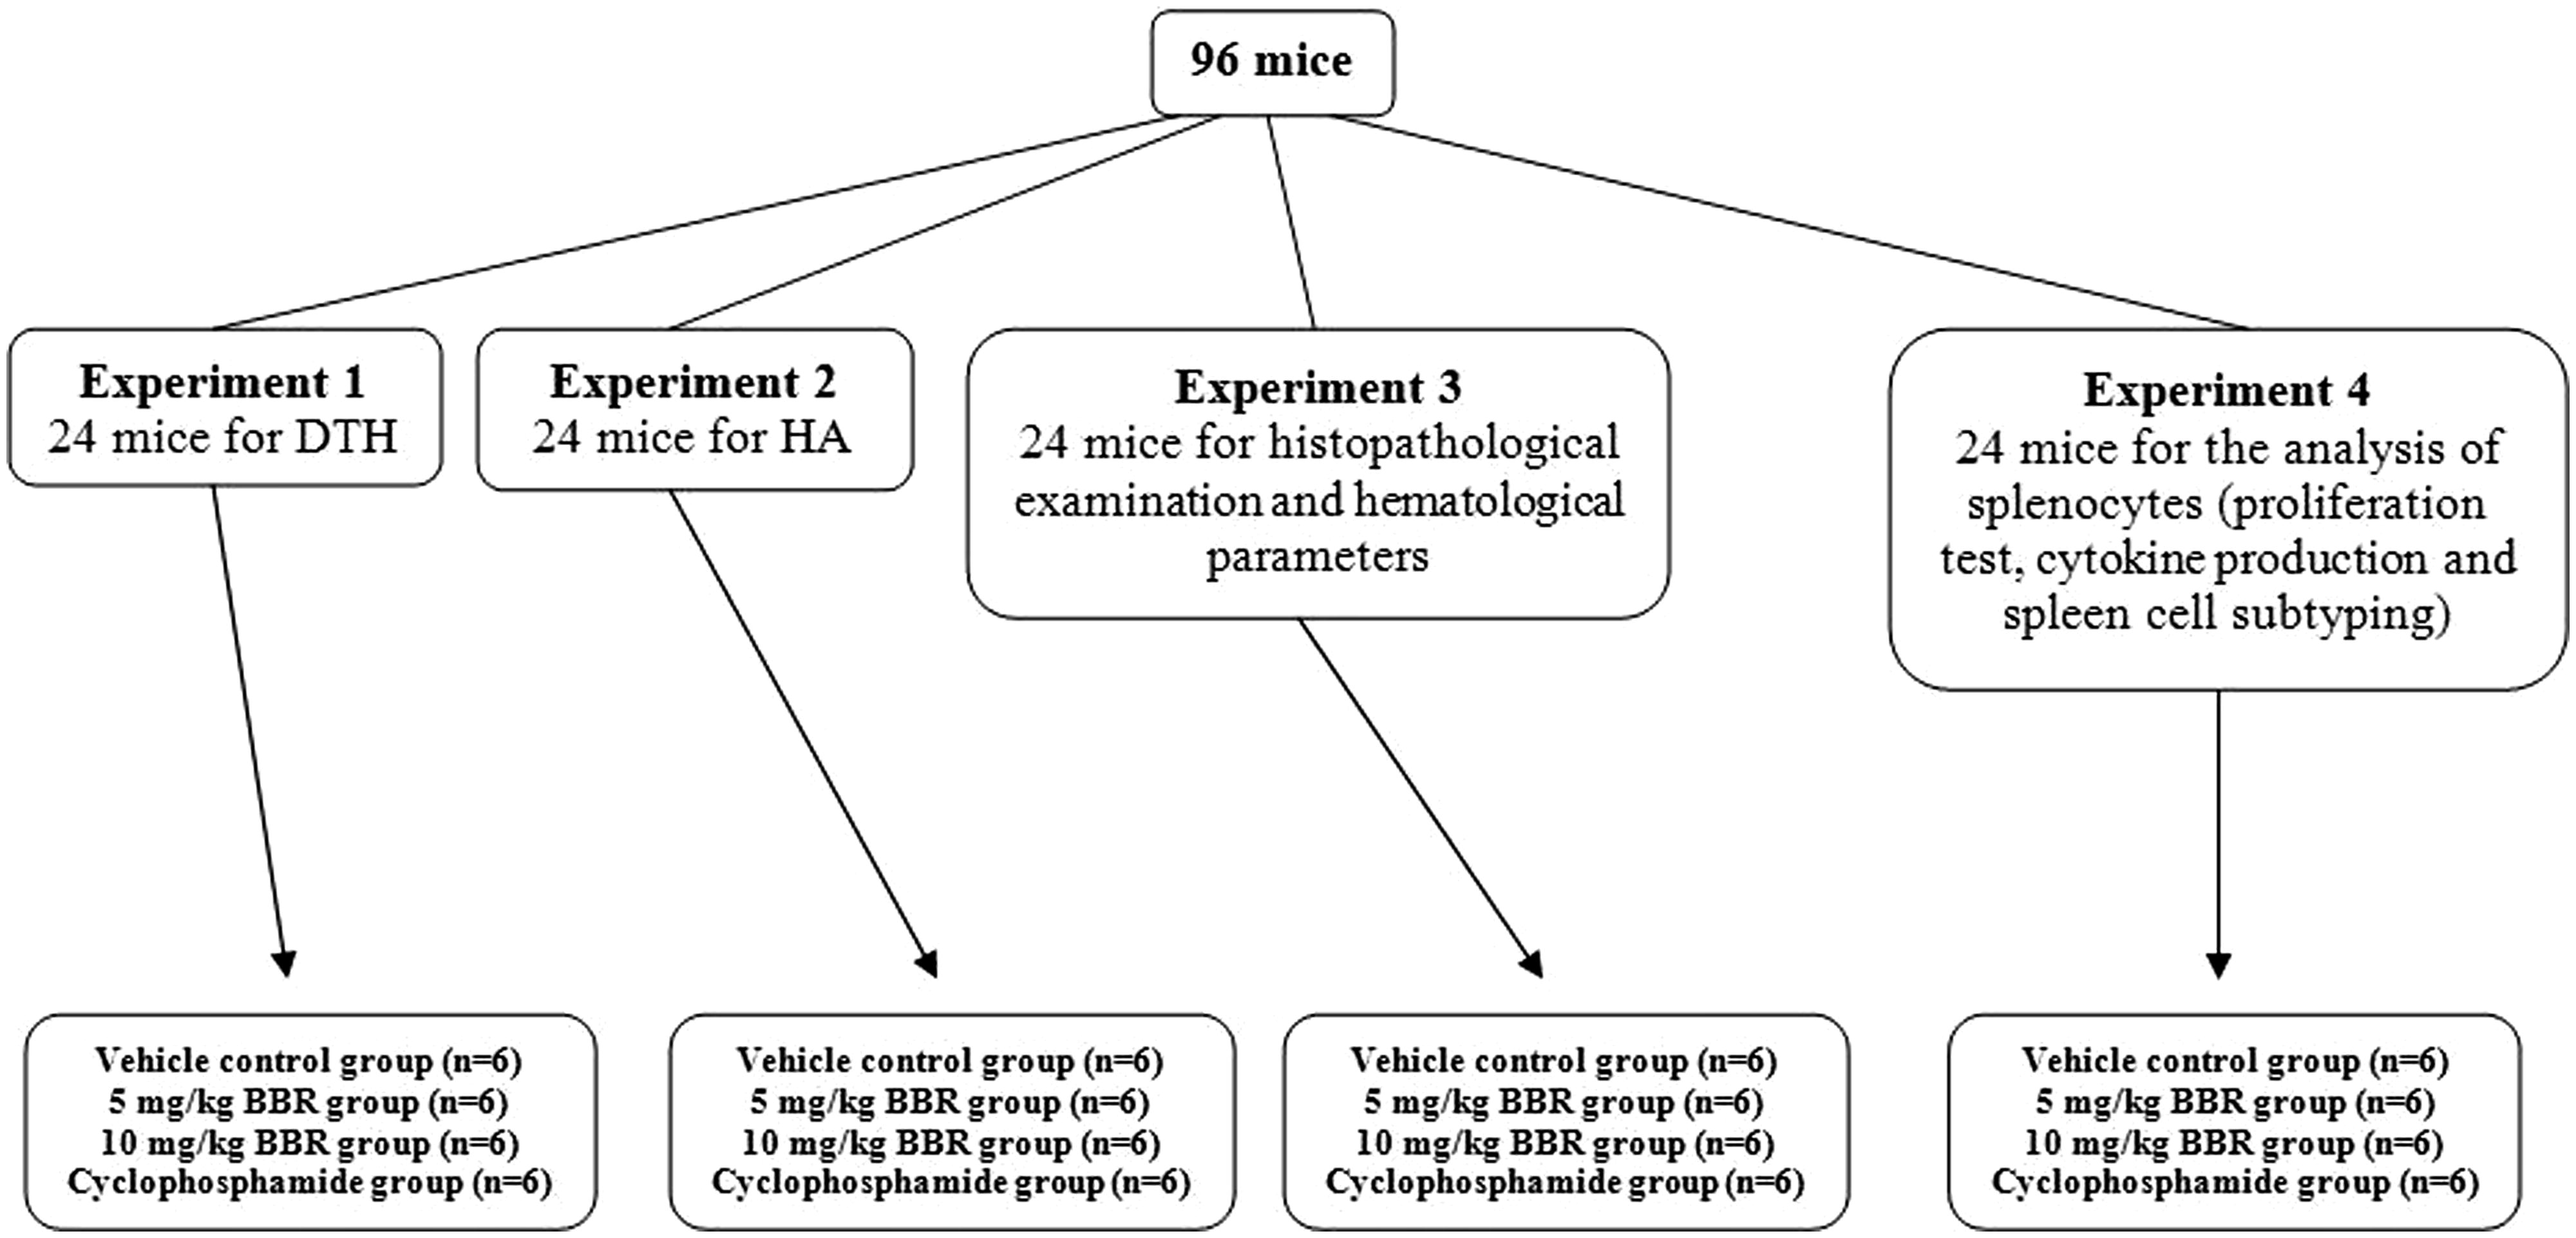
Table 1. Effects of subacute exposure to berberine (BBR, IP daily, 14 days) on blood cellularity.
Table 2. Effects of subacute exposure to berberine (BBR, IP daily, 14 days) on mouse spleen cell subtypes.
Figure 2. Pathologic changes in spleen after administration of 10 mg BBR/kg/day. (a) Vehicle-control group: White pulps with well-formed lymphoid follicles containing active germinal centers. (b) 10 mg BBR/kg/day group: Atrophic white pulps with relatively small lymphoid follicles. Each figure is a representative photomicrograph from a mouse in each group. Magnification = 100×.
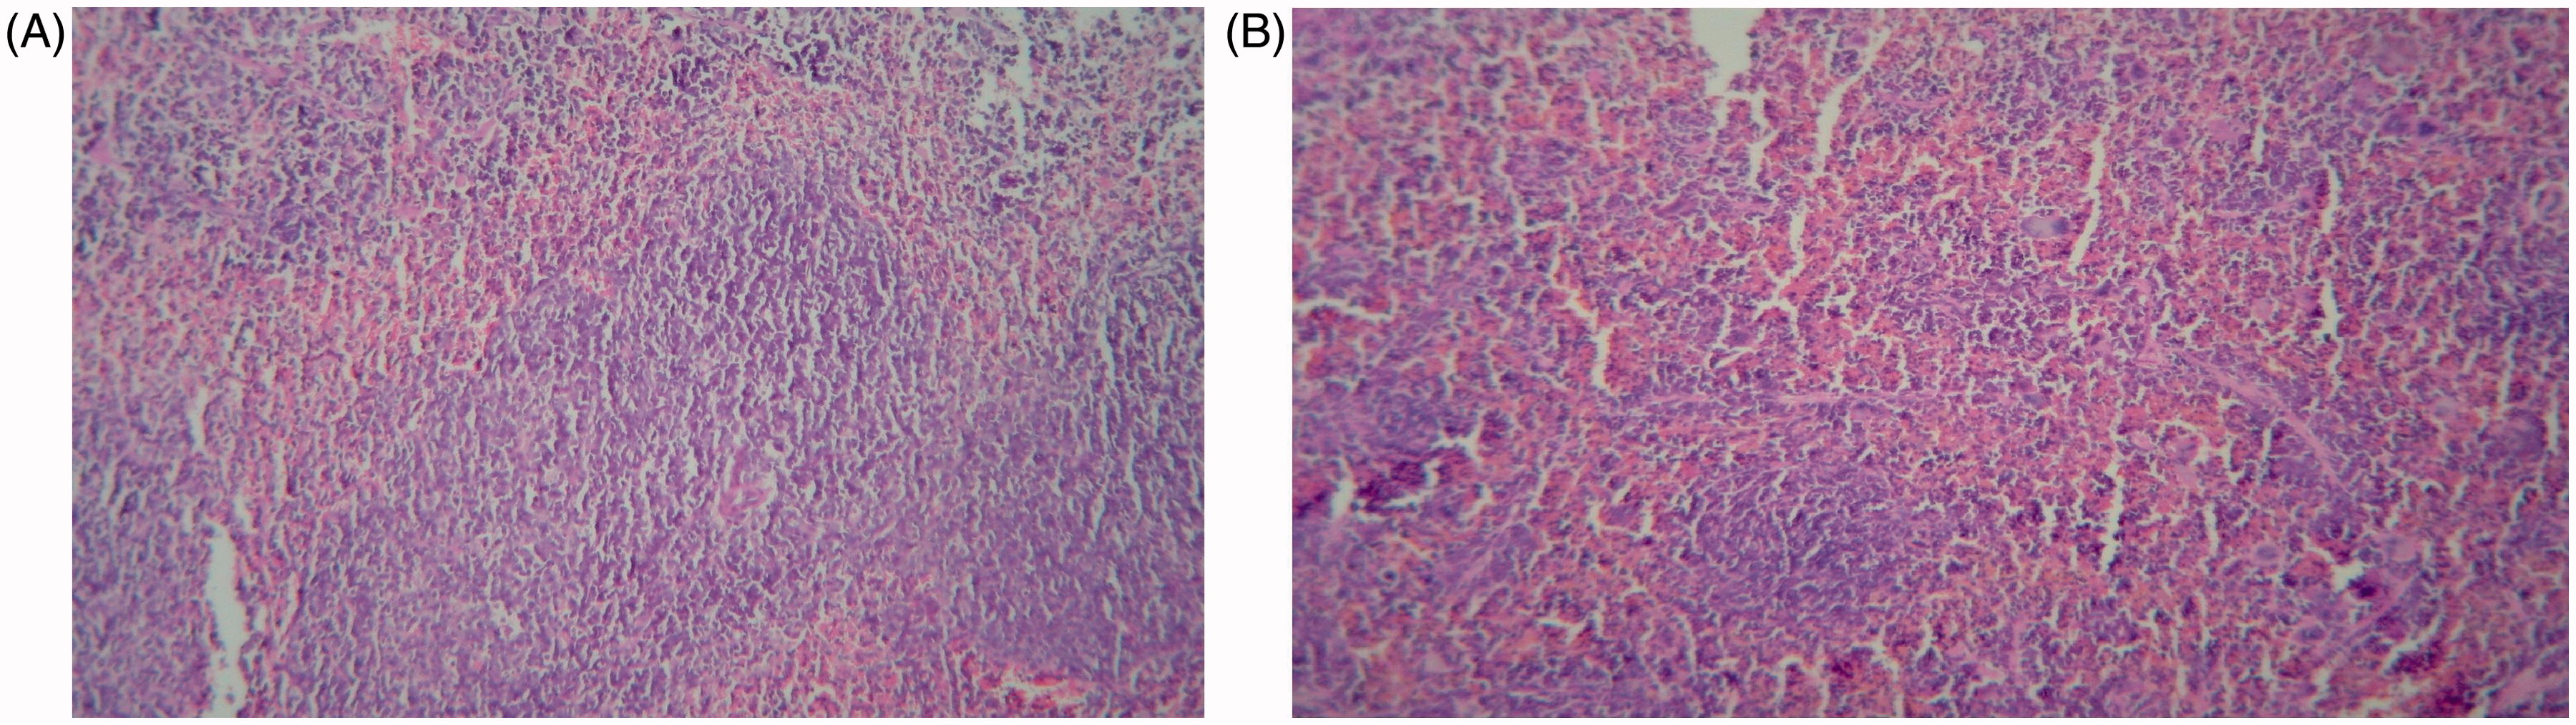
Figure 3. Effects of subacute berberine (BBR, 14 days) exposure on mouse antibody response. Levels of anti-SRBC produced in serum harvested from mice 24 h after the final treatment (on Day 15) in indicated regimens. Values shown are mean ± SE (n = 6/group). Value significantly different from vehicle control mice (**p < 0.01 or ***p < 0.001); ##Significantly different versus positive control (CYP) (p < 0.01); or ‡‡significantly different as a function of BBR dose (p < 0.01).
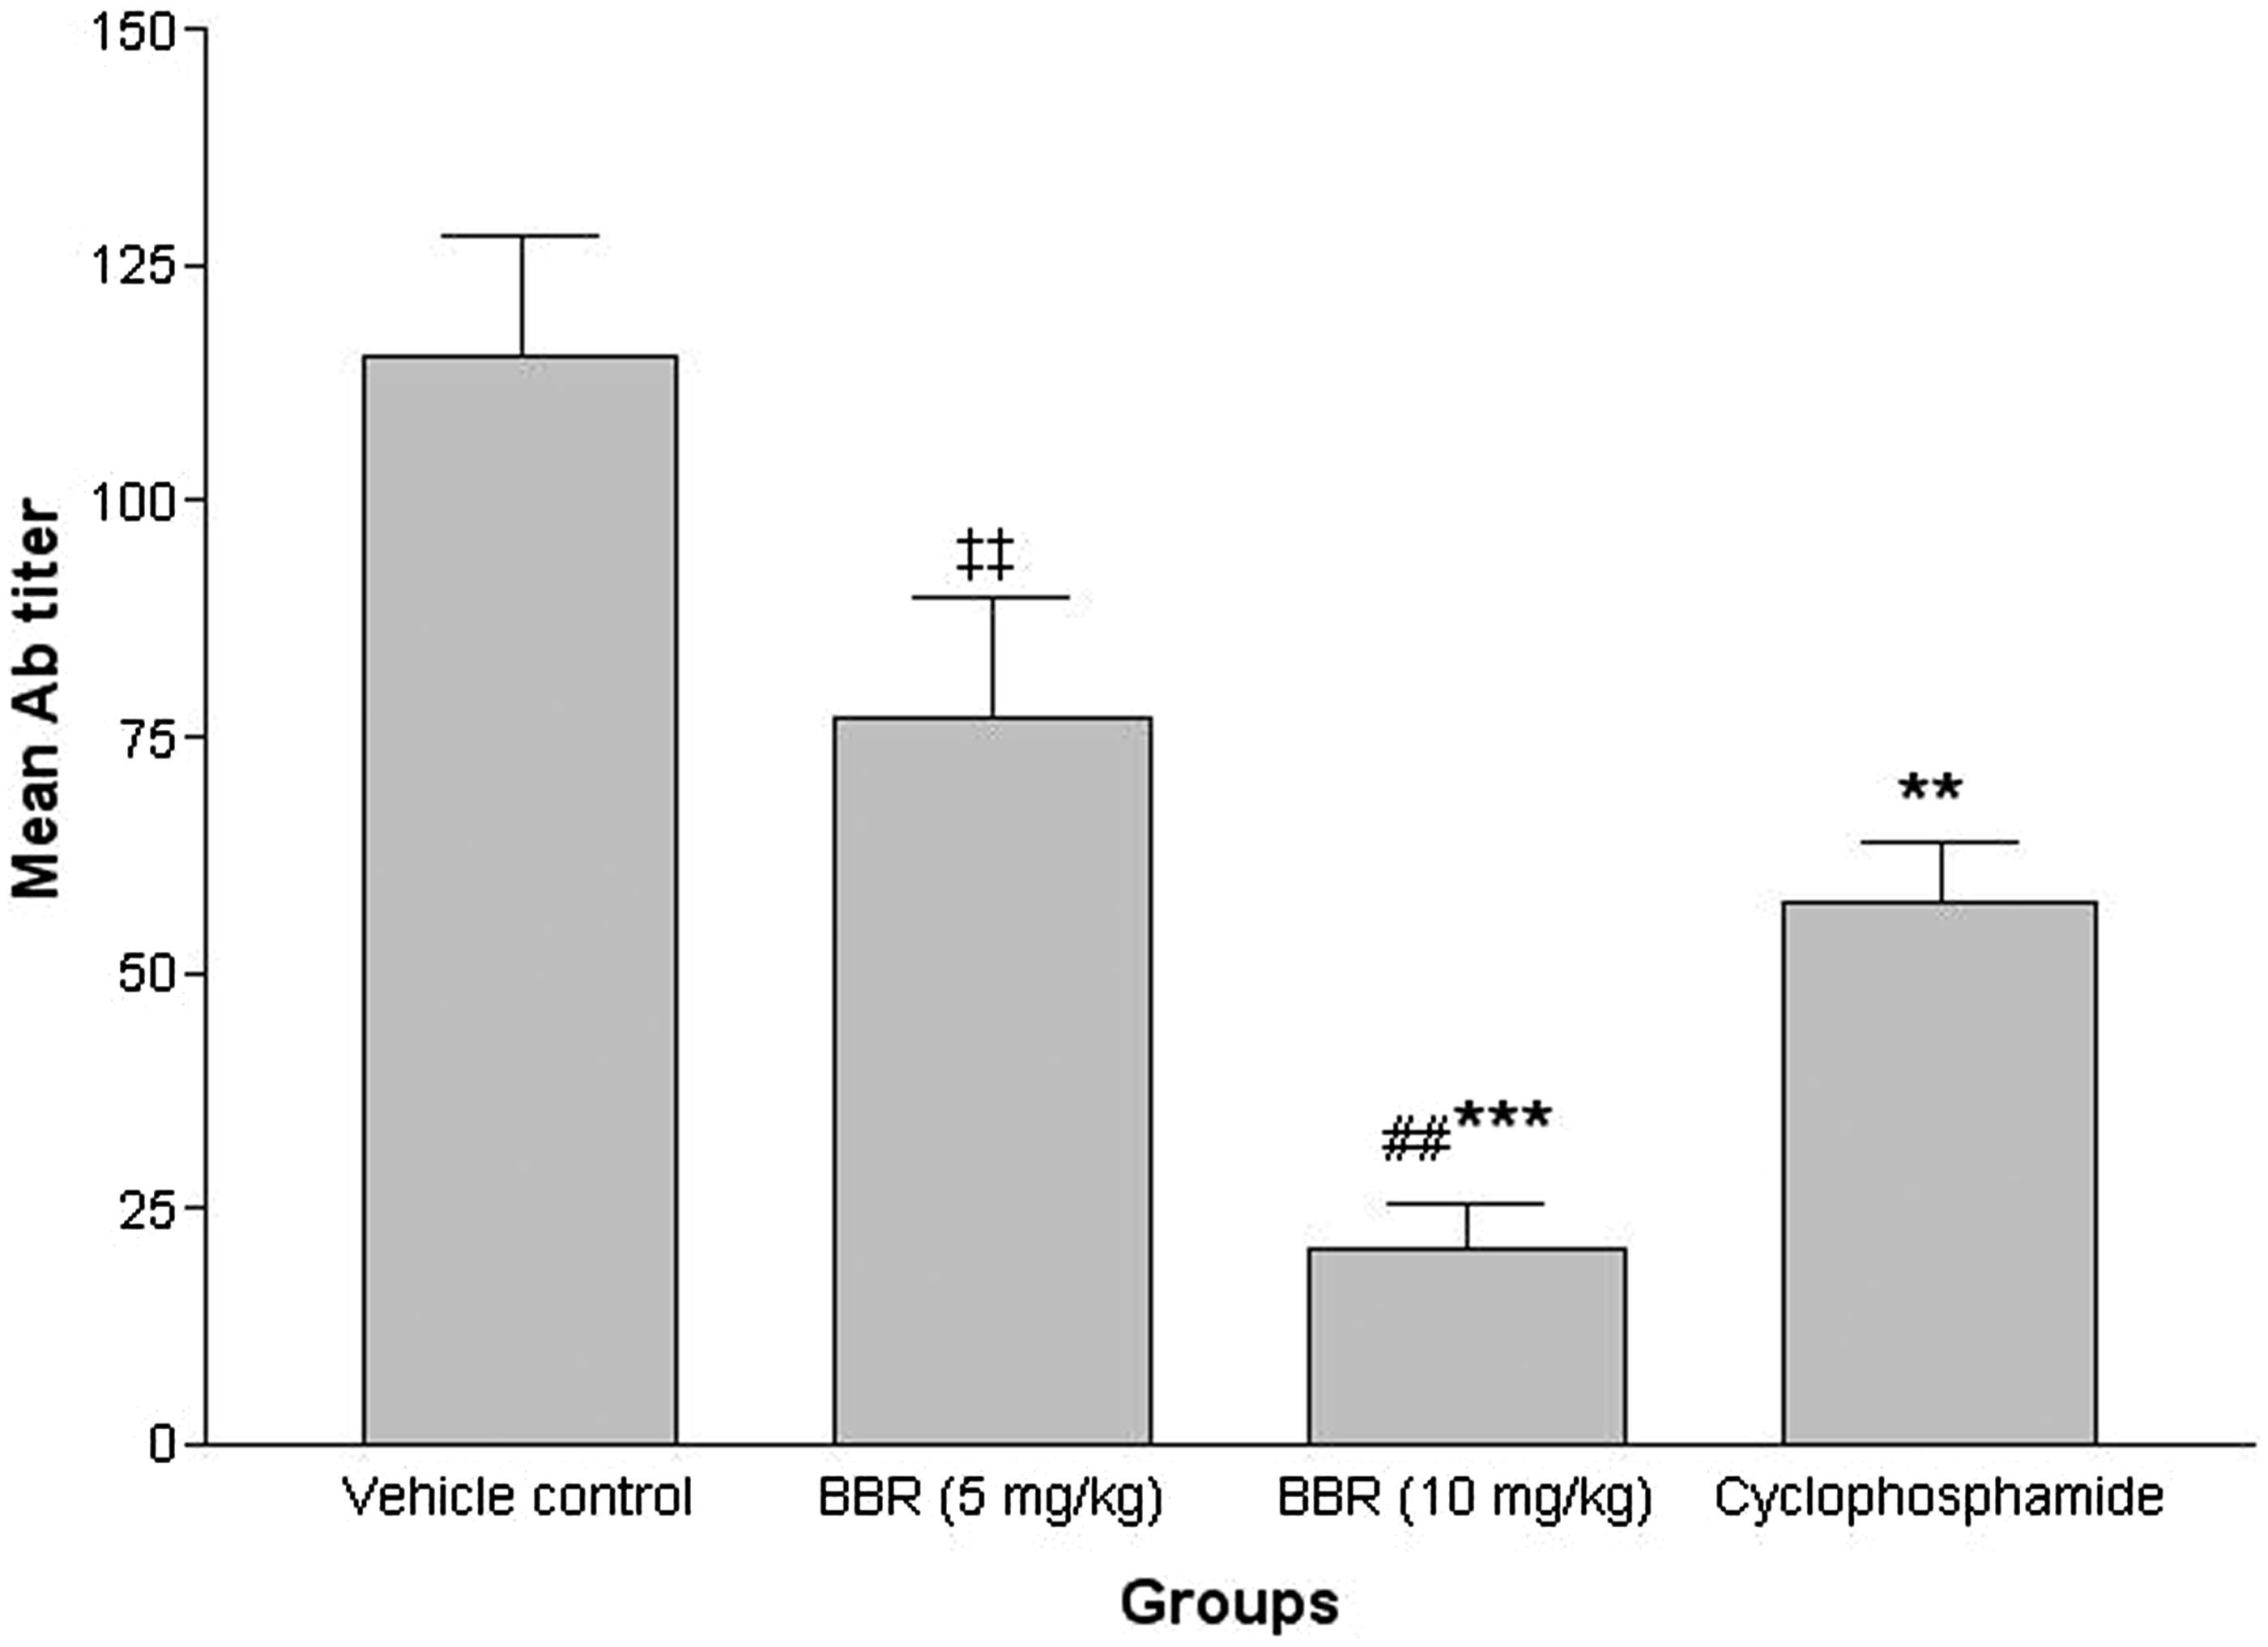
Figure 4. Effects of subacute berberine (BBR, 14 days) exposure on mice DTH response. The percentage increase in paw thickness of mice 24, 48 and 72 h after footpad SRBC challenge in indicated regimens. Values shown are mean ± SE (n = 6/group). Value significantly different from vehicle control mice at *p < 0.05 or **p < 0.01; #significantly different versus positive control (CYP) (p < 0.05); or ‡significantly different as a function of BBR dose (p < 0.05).
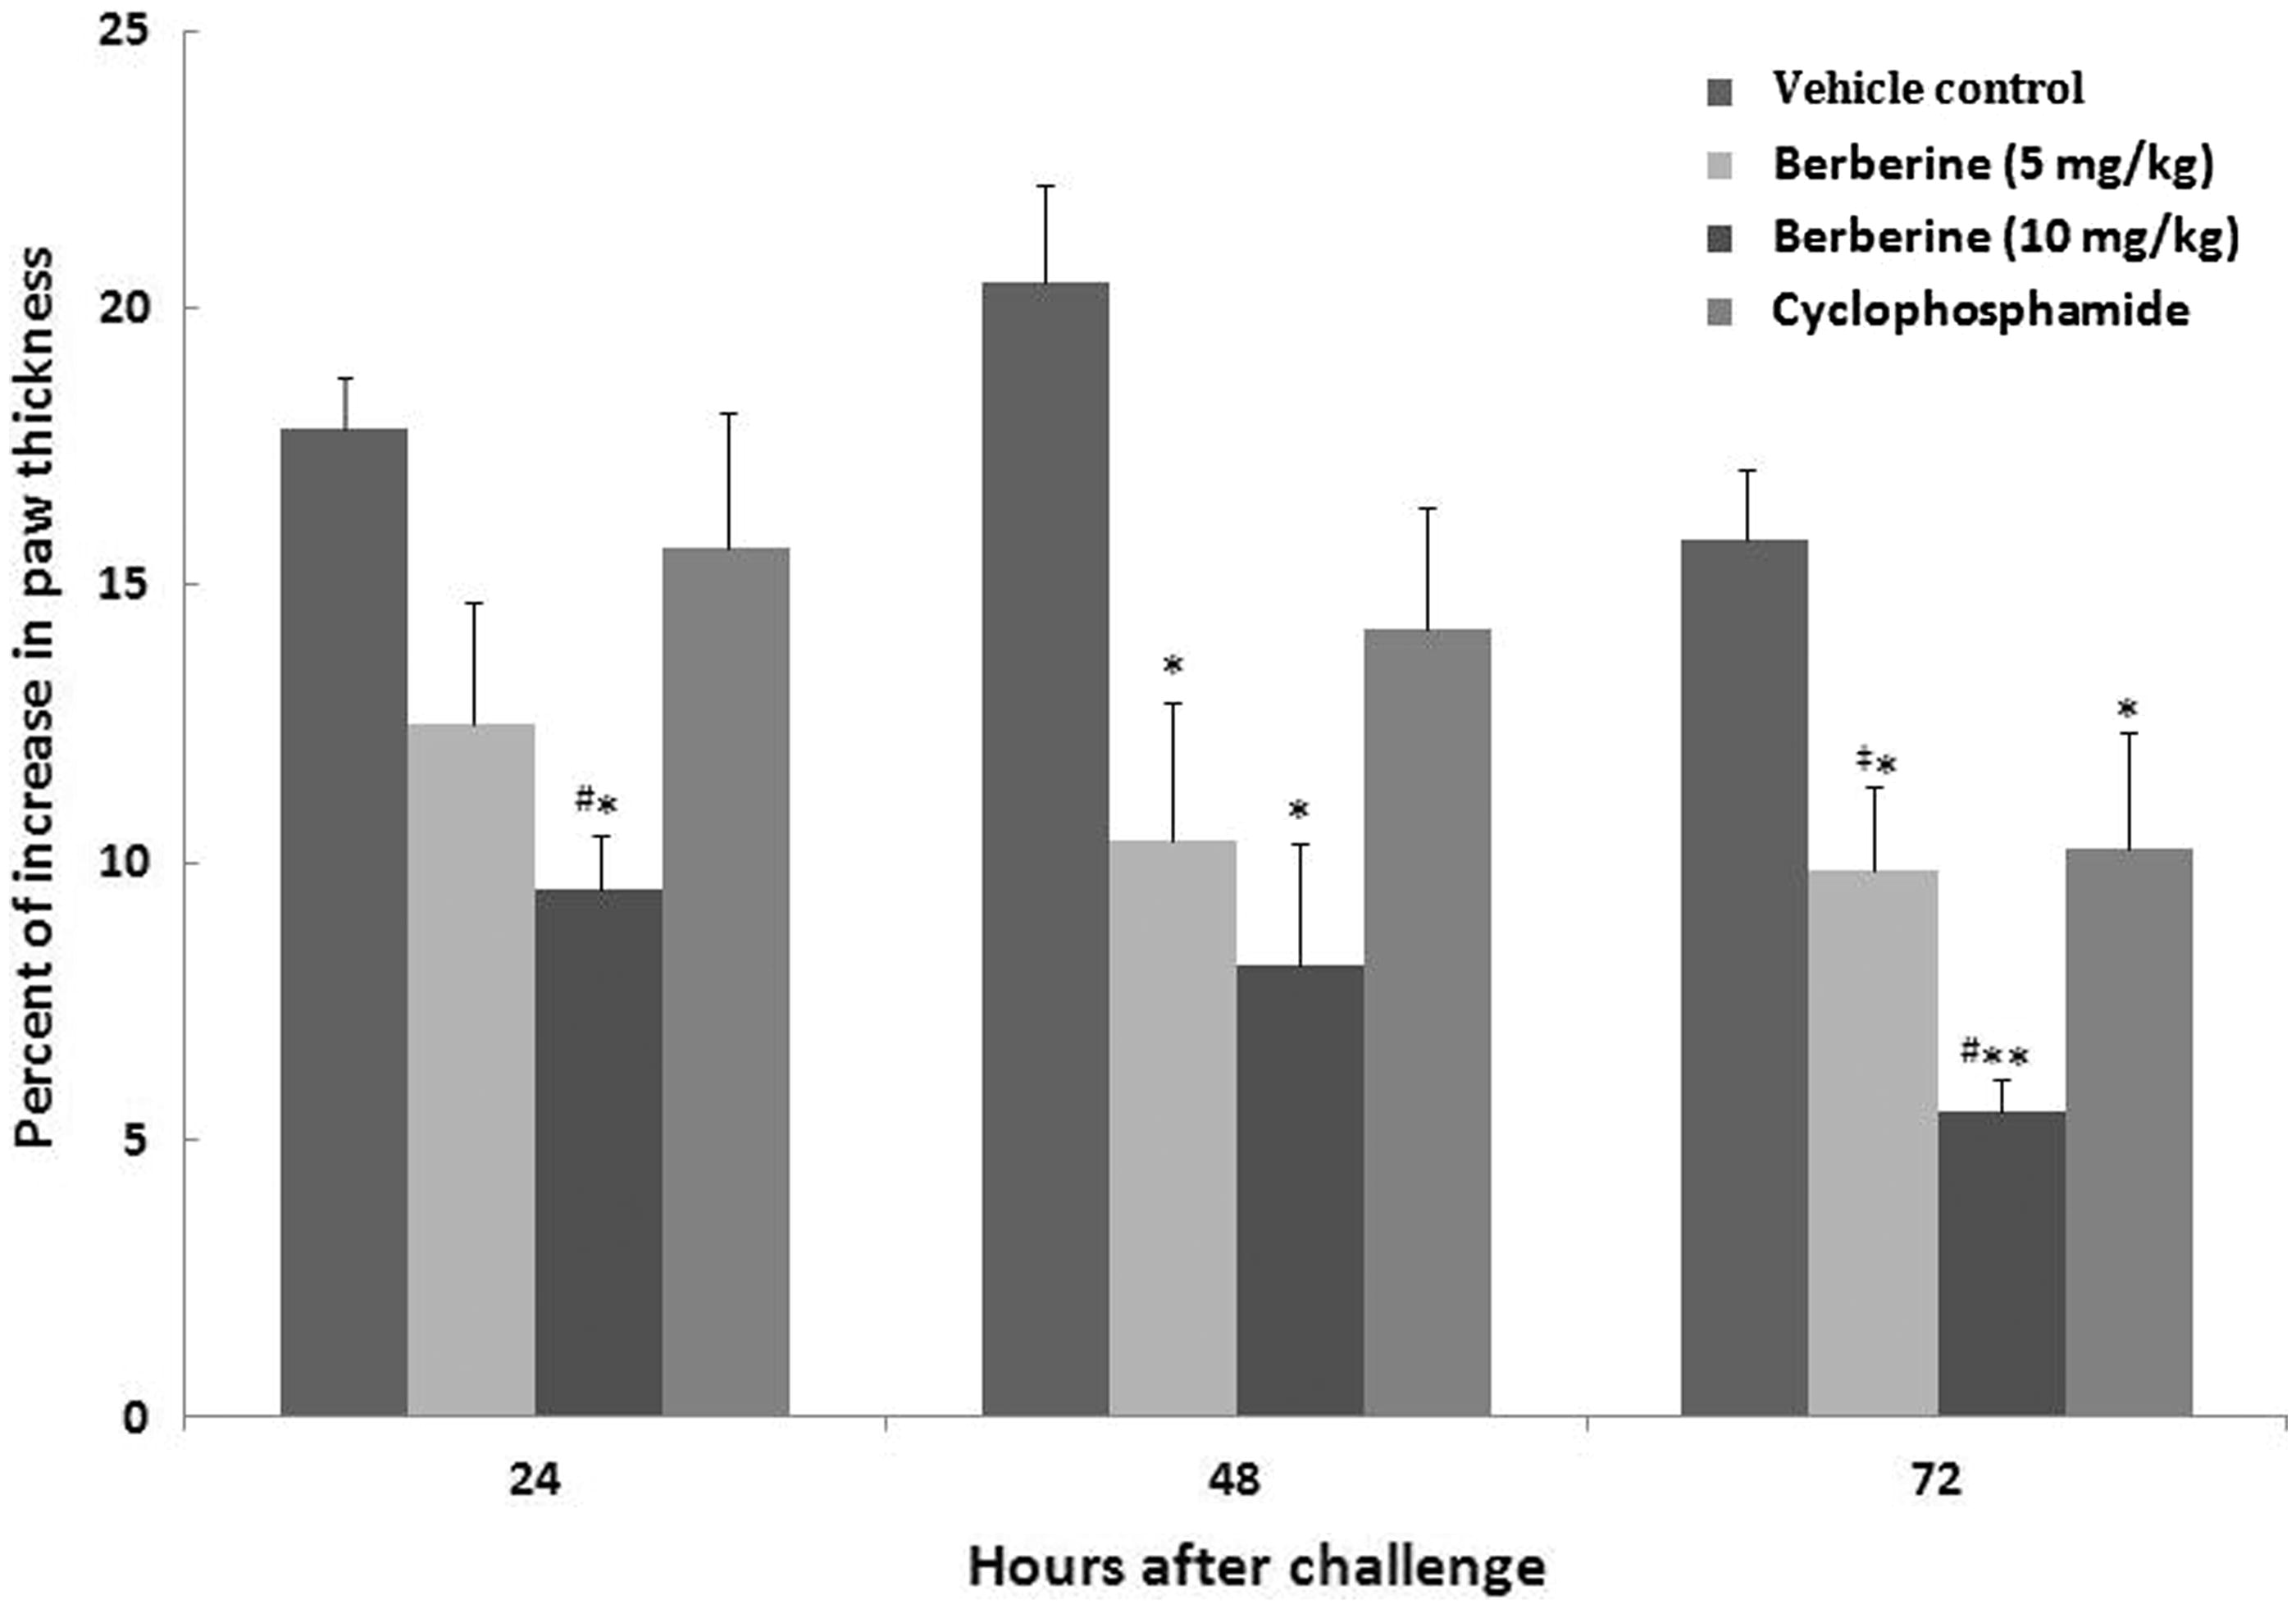
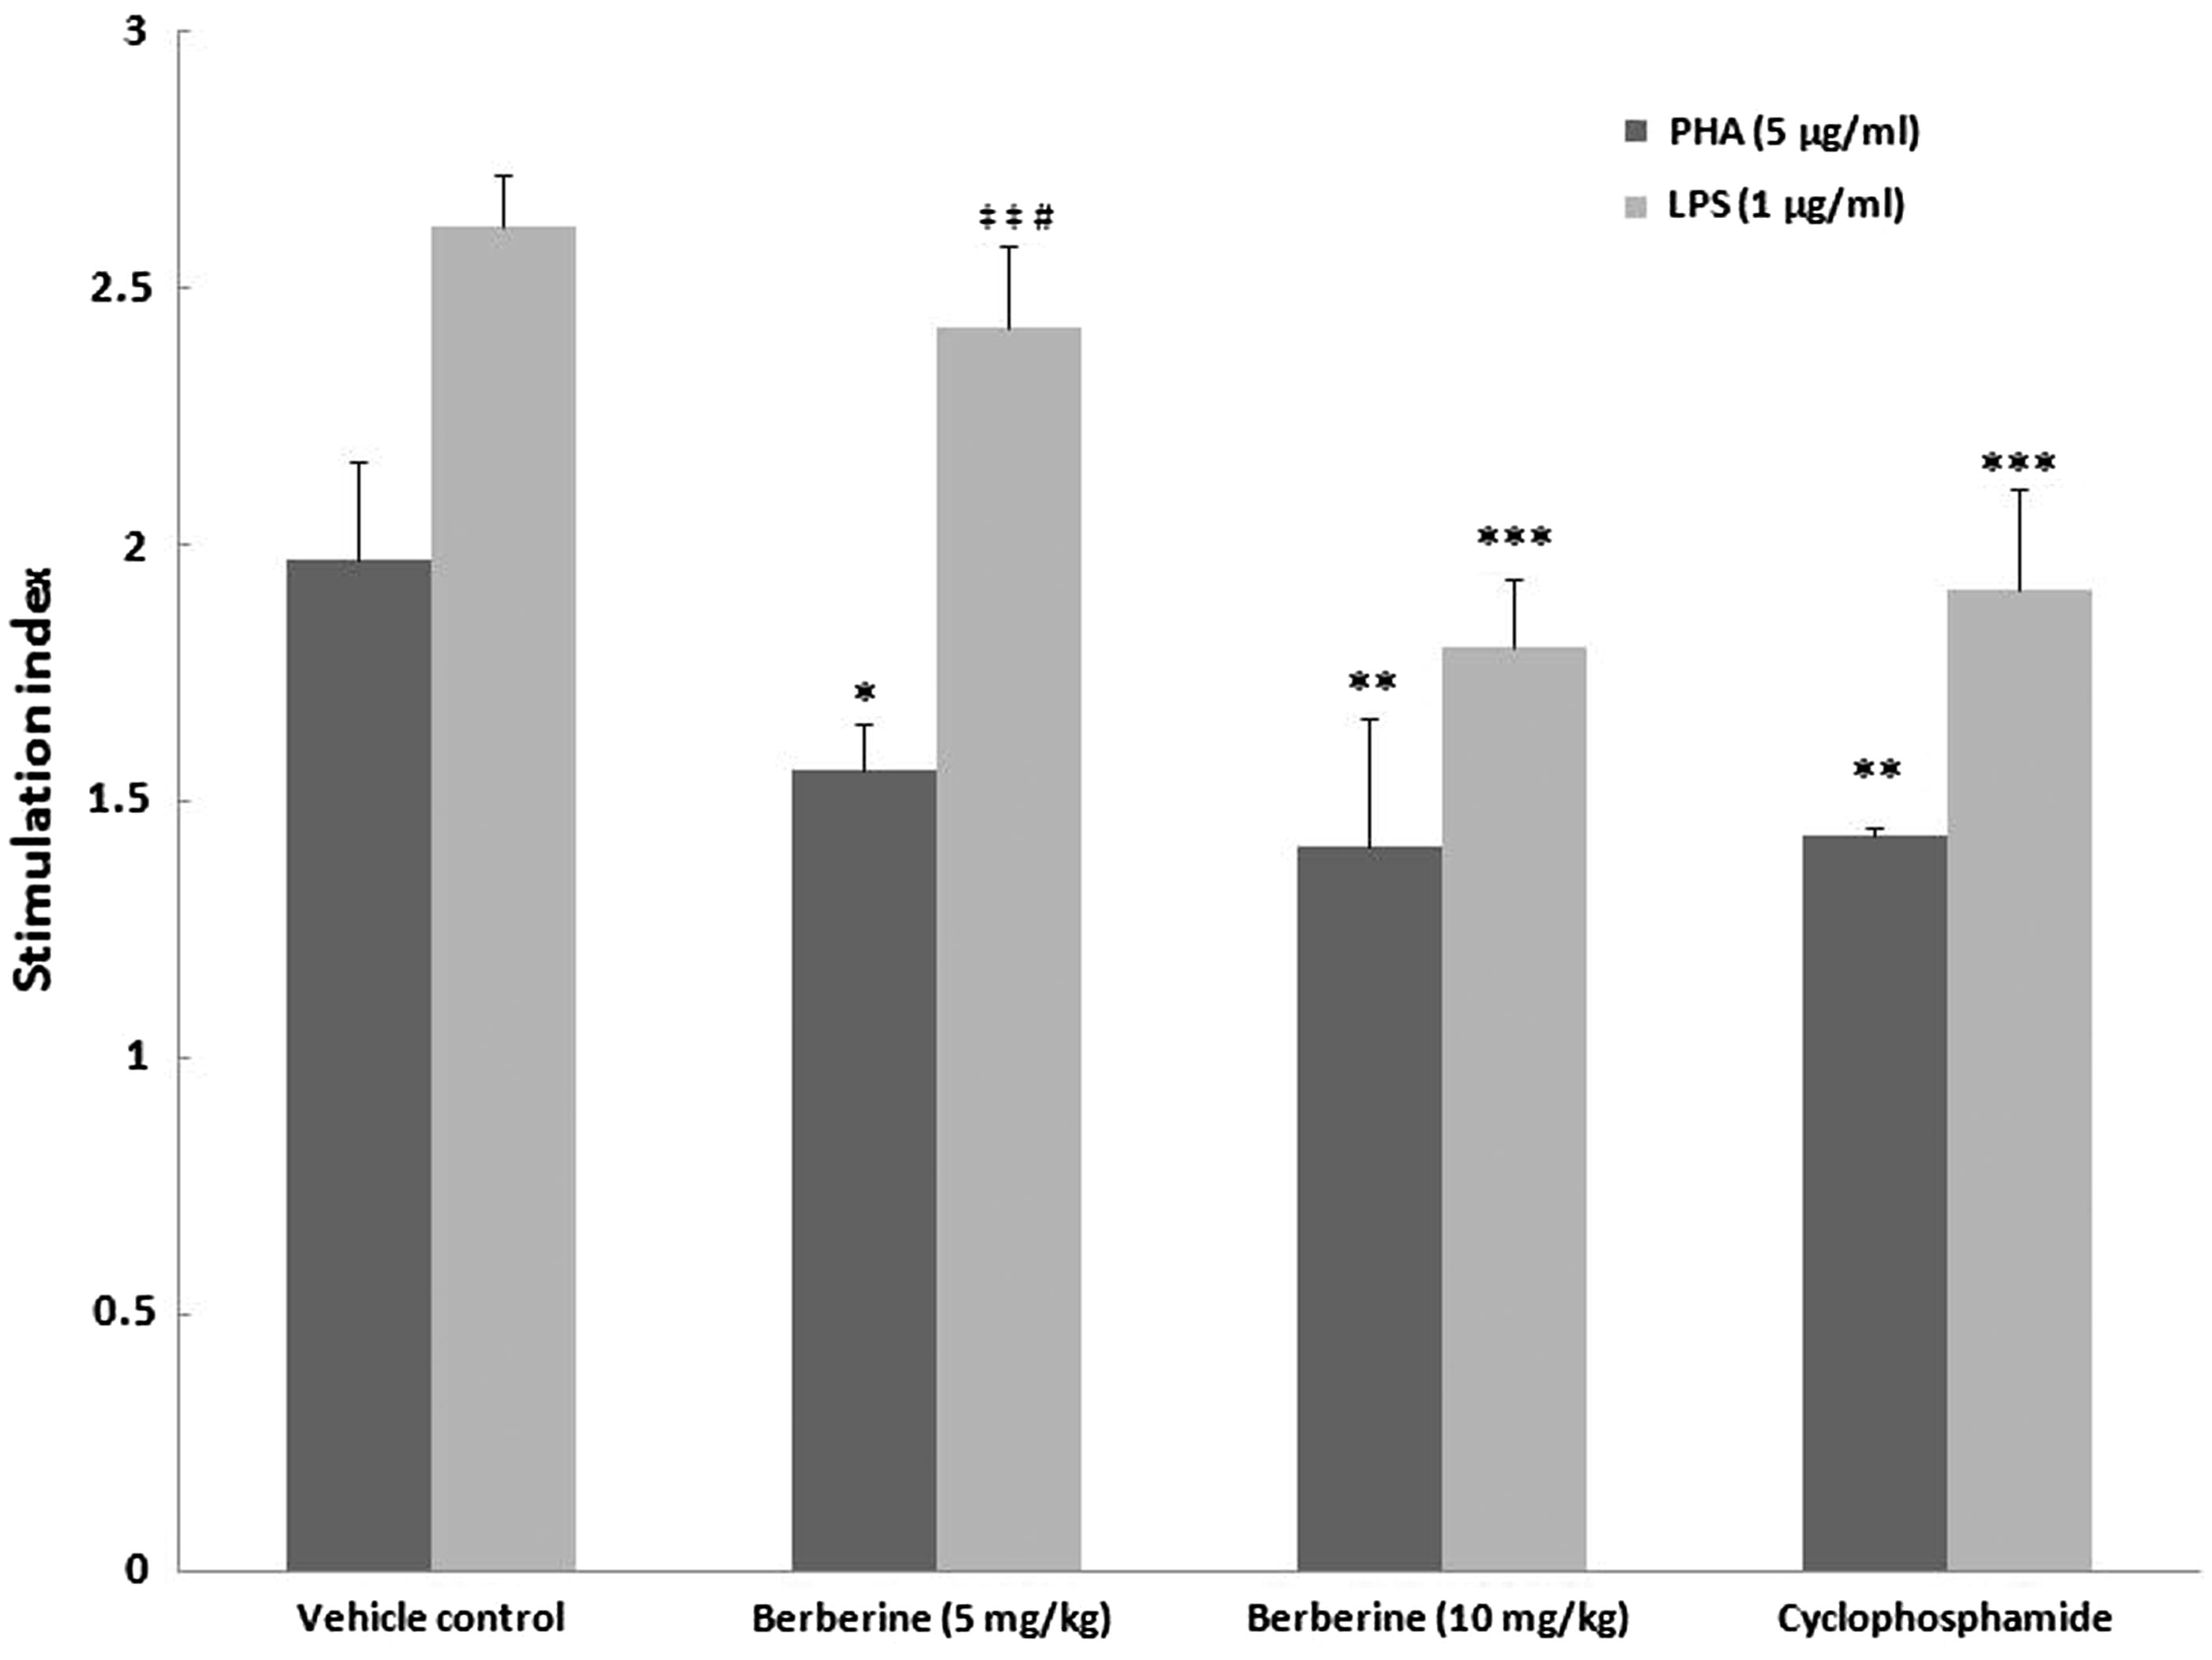
Figure 5. Effects of subacute berberine (BBR, 14 days) exposure on ex vivo lymphocyte proliferation. The SI values shown are based upon measures associated with splenocytes harvested from mice 24 h after final treatment (on Day 15) in each regimen. With each treatment group, SI values were calculated from absorbance values for PHA (or LPS)-stimulated cells/absorbance values for unstimulated cells from the same hosts. Values shown are mean ± SE (n = 6/group). Values significantly different from stimulated vehicle control counterpart at *p < 0.05, **p < 0.01 or ***p < 0.001. Value is significantly different versus positive control (CYP) (at #p < 0.05) or as a function of BBR dose (at ‡‡p < 0.01).