Figures & data
Table: Generic Codes Added in 2011.
Table 1A. AAPCC population: served and reported exposures (1983–2011).
Table 1B. Non-human exposures by animal type.
Table 1C. Distribution of information calls.
Fig. 1. Human Exposure Calls, Information Calls and Animal Exposure Calls by Day since 1 January 2000. Black lines show least-squares second order regression–both linear and second order (quadratic) terms were statistically significant for each of the 3 regressions.
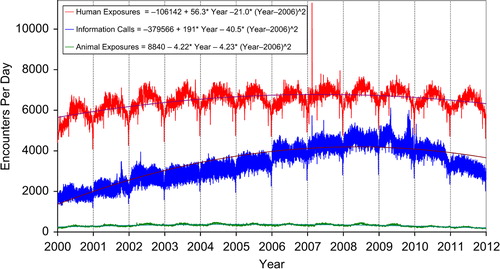
Fig. 2. All Drug Identification and Law Enforcement Drug Identification Calls by Day since 1 January 2000. Black line shows least-squares second order regression–both linear and second order (quadratic) terms were statistically significant for the Law Enforcement Drug ID Calls.
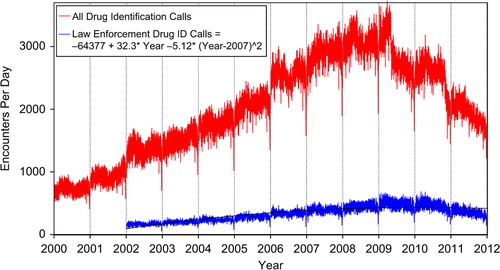
Fig. 3. Health Care Facility (HCF) Exposure Calls and HCF Information Calls by Day since 1 January 2000. Black lines show least-squares first and second order regressions—linear regression for HCF Exposure Calls (second order term was not statistically significant) and second order regression for HCF Information Calls. All terms shown were statistically significant for each of the 2 regressions.
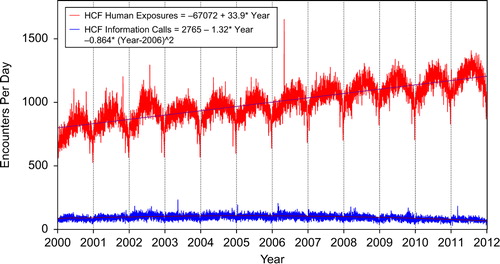
Table 2. Site of call and site of exposure, human exposure cases.
Table 3A. Age and gender distribution of human exposures.
Table 3B. Population-adjusted exposures by age group.
Table 4. Distribution of agea and gender for fatalities.b
Table 5. Number of substances involved in human exposure cases.
Table 6A. Reason for human exposure cases.
Table 6B. Scenarios for therapeutic errorsa by age.b
Table 7. Distribution of reason for exposure by age.
Table 8. Distribution of reason for exposure and age for fatalities.a
Table 9. Route of exposure for human exposure cases.
Table 10. Management site of human exposures.
Table 11. Medical outcome of human exposure cases by patient age.a
Table 12. Medical outcome by reason for exposure in human exposures.a
Table 13. Duration of clinical effects by medical outcome.
Table 14. Decontamination and therapeutic interventions.
Table 15. Therapy provided in human exposures by age.
Table 16A. Decontamination trends (1985–2011).
Table 16B. Decontamination Trends: Total Human and Pediatric Exposures < = 5 Years (2011).a
Table 17A. Substance categories most frequently involved in human exposures (Top 25).
Fig. 4. Change in Exposure Calls by Outcome from 2010 to 2011. The figure shows how the decrease of 94,530 in Human Exposure Calls divides among the 10 Medical Outcomes. The More Serious Exposures (Minor, Moderate, Major, and Death) all increased and their combined increase was 22,175 calls (23.5% of the 94,530 total decrease). The Less Serious Exposures (the other 6 outcome groups) decreased by 116,705 (− 123.5% of the 94,530 total decrease). *Excludes CONFIRMED NONEXPOSURES and INDIRECT DEATH.
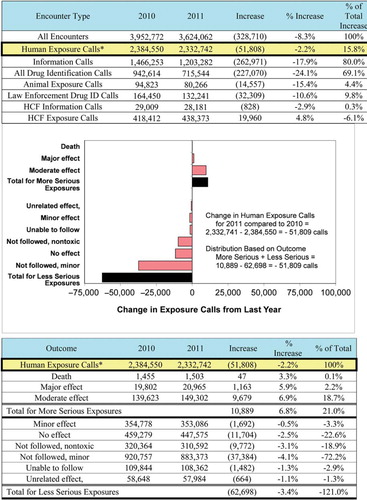
Fig. 5. Human Exposure Call Increases by Year 2000–2011 – Top 4 Categories. Solid lines show least-squares linear regressions for the Human Exposure Calls per year for that category (□). Broken lines show 95% confidence interval on the regression.
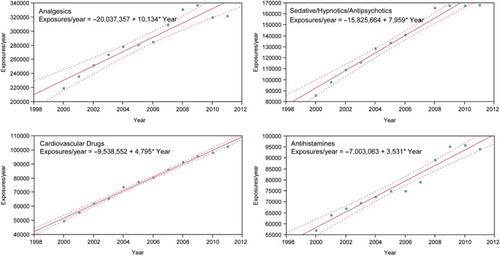
Table 17B. Substance categories with the greatest rate of exposure increase (Top 25).
Table 17C. Substance categories most frequently involved in pediatric (≤ 5 years) exposures (Top 25).a
Table 17D. Substance categories most frequently involved in adult (≥ 20 years) exposures (Top 25).a
Table 17E. Substance categories most frequently involved in pediatric (≤ 5 years) deaths.a
Table 17F. Substance categories most frequently identified in drug identification calls (Top 25).
Table 17G. Substance categories most frequently involved in pregnant exposuresa (Top 25).
Table 18. Categories associated with largest number of fatalities (Top 25).a
Table 19A. Comparisons of death data (1985–2011).a
Table 19B. Comparisons of direct and indirect death data (2006–2011).a
Table 20. Frequency of plant exposures (Top 25).a
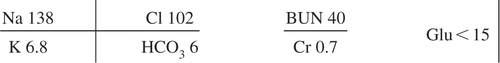
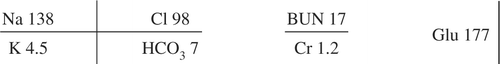
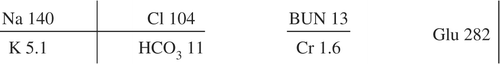
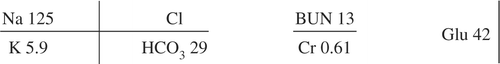
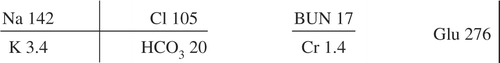
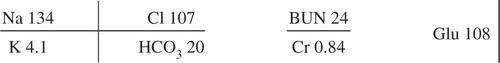
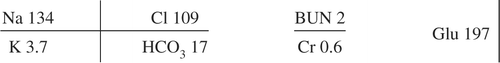
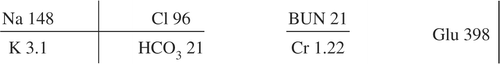
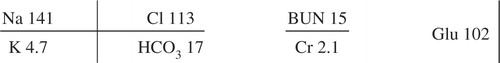
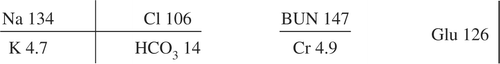
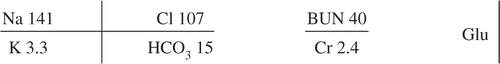
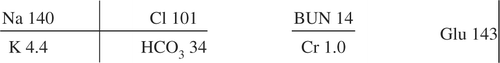
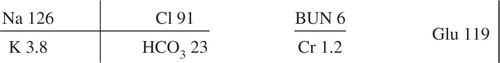
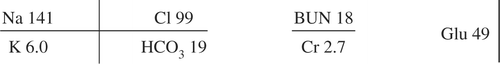
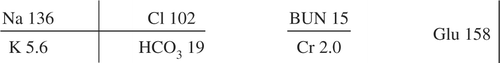
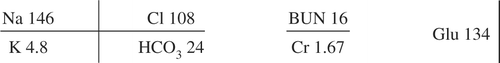
Table 21. Listing of fatal nonpharmaceutical and pharmaceutical exposures.
Table 22A. Demographic profile of SINGLE SUBSTANCE Nonpharmaceuticals exposure cases by generic category.
Table 22B. Demographic profile of SINGLE SUBSTANCE Pharmaceuticals exposure cases by generic category.