Figures & data
Table: Generic Codes Added in 2012.
Table 1A. AAPCC Population Served and Reported Exposures (1983–2012).
Table 1B. Non-Human Exposures by Animal Type.
Table 1C. Distribution of Information Calls.
Fig. 1. Human Exposure Calls, Information Calls, and Animal Exposure Calls by Day since January 1, 2000 Regression lines show least-squares second order regression—both linear and second order (quadratic) terms were statistically significant for Human Exposures and Animal Exposures (colour version of this figure can be found in the online version at www.informahealthcare.com/ctx).
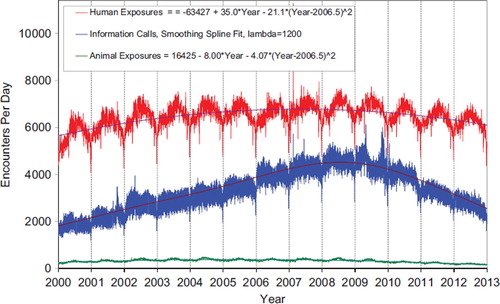
Fig. 2. All Drug Identification and Law Enforcement Drug Identification Calls by Day since January 1, 2000 Smoothing Spline Fits were better than 2nd order regressions, R-Square = 0.796 for All Drug Identification Calls, R-Square = 0.632 Law Enforcement Drug ID Calls (colour version of this figure can be found in the online version at www.informahealthcare.com/ctx).
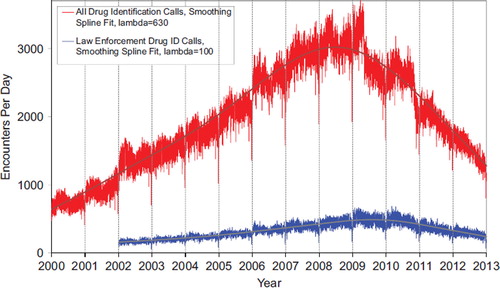
Fig. 3. HCF Exposure Calls and HCF Information Calls by Day since January 1, 2000 Regression lines show least-squares first and second order regressions—linear regression for HCF Exposure Calls (second order term was not statistically significant) and second order regression for HCF Information Calls. All terms shown were statistically significant for each of the two regressions (colour version of this figure can be found in the online version at www.informahealthcare.com/ctx).
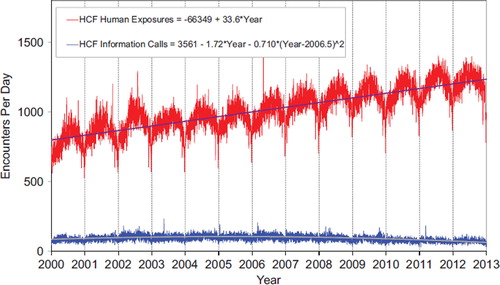
Table 2. Site of Call and Site of Exposure, Human Exposure Cases.
Table 3A. Age and Gender Distribution of Human Exposures.
Table 3B. Population-Adjusted Exposures by Age Group.
Table 4. Distribution of Agea and Gender for Fatalitiesb.
Table 5. Number of Substances Involved in Human Exposure Cases.
Table 6A. Reason for Human Exposure Cases.
Table 6B. Scenarios for Therapeutic Errorsa by Ageb.
Table 7. Distribution of Reason for Exposure by Age.
Table 8. Distribution of Reason for Exposure and Age for Fatalitiesa.
Table 9. Route of Exposure for Human Exposure Cases.
Table 10. Management Site of Human Exposures.
Table 11. Medical Outcome of Human Exposure Cases by Patient Age.a
Table 12. Medical Outcome by Reason for Exposure in Human Exposuresa.
Table 13. Duration of Clinical Effects by Medical Outcome.
Table 14. Decontamination and Therapeutic Interventions.
Table 15. Therapy Provided in Human Exposures by Age.
Table 16A. Decontamination Trends (1985–2012).
Table 16B. Decontamination Trends: Total Human and Pediatric Exposures ≤ 5 Yearsa.
Table 17A. Substance Categories Most Frequently Involved in Human Exposures (Top 25).
Table 17B. Substance Categories with the Greatest Rate of Exposure Increase (Top 25).
Table 17C. Substance Categories Most Frequently Involved in Pediatric (≤ 5 years) Exposures (Top 25).a
Table 17D. Substance Categories Most Frequently Involved in Adult (≤ 20 years) Exposures (Top 25).a
Table 17E. Substance Categories Most Frequently Involved in Pediatric (≤ 5 years) Deaths.a
Table 17F. Substance Categories Most Frequently Identified in Drug Identification Calls (Top 25).
Table 17G. Substance Categories Most Frequently Involved in Pregnant Exposuresa (Top 25).
Fig. 4. Change in Encounters by Outcome from 2008 to 2012. The Figure shows the percent change from baseline for Human Exposure Calls divided among the 10 Medical Outcomes. The More Serious Exposures (Major, Moderate, and Death) increased. The Less Serious Exposures (no effect, minor effect, not followed (non-toxic), not followed (minimal toxicity possible), unable to follow (potentially toxic), and unrelated effect) decreased after 2008. Solid lines show least-squares linear regressions for the change in More Serious Exposures per year (□) and Less Serious Exposures (○). Broken lines show 95% confidence interval on the regression (colour version of this figure can be found in the online version at www.informahealthcare.com/ctx).
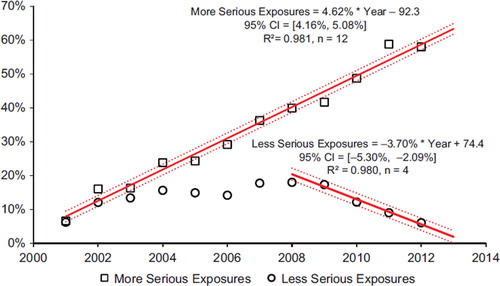
Fig. 5. Substance Categories with the Greatest Rate of Exposure Increase (Top 4). Solid lines show least-squares linear regressions for the Human Exposure Calls per year for that category (□). Broken lines show 95% confidence interval on the regression (colour version of this figure can be found in the online version at www.informahealthcare.com/ctx).
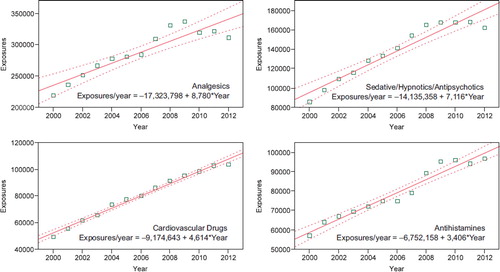
Table 18. Categories Associated with Largest Number of Fatalities (Top 25).a
Table 19A. Comparisons of Death Data (1985–2012).a
Table 19B. Comparisons of Direct and Indirect Death Data (2000–2012).a
Table 20. Frequency of Plant Exposures (Top 25).a
Table 21. Listing of fatal nonpharmaceutical and pharmaceutical exposures.
Table 22A. Demographic profile of SINGLE-SUBSTANCE Nonpharmaceuticals exposure cases by generic category.
Table 22B. Demographic profile of SINGLE-SUBSTANCE Pharmaceuticals exposure cases by generic category.
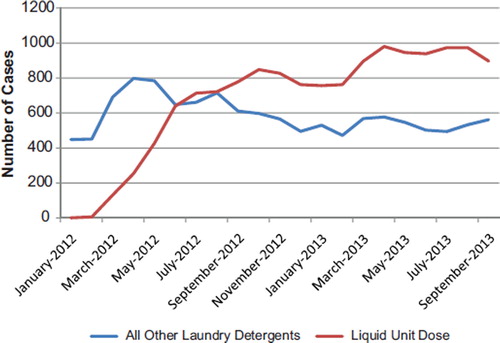
Fig. 6. Unit Dose Liquid Laundry Detergent Exposures, Jan 2012—Sep 2013. The Figure shows the number of calls received for single-substance human pediatric poison exposure calls to Unit Dose Liquid Laundry Detergents (![]()